This site uses cookies to improve your experience. To help us insure we adhere to various privacy regulations, please select your country/region of residence. If you do not select a country, we will assume you are from the United States. Select your Cookie Settings or view our Privacy Policy and Terms of Use.
Cookie Settings
Cookies and similar technologies are used on this website for proper function of the website, for tracking performance analytics and for marketing purposes. We and some of our third-party providers may use cookie data for various purposes. Please review the cookie settings below and choose your preference.
Used for the proper function of the website
Used for monitoring website traffic and interactions
Cookie Settings
Cookies and similar technologies are used on this website for proper function of the website, for tracking performance analytics and for marketing purposes. We and some of our third-party providers may use cookie data for various purposes. Please review the cookie settings below and choose your preference.
Strictly Necessary: Used for the proper function of the website
Performance/Analytics: Used for monitoring website traffic and interactions
With the growing emphasis on data, organizations are constantly seeking more efficient and agile ways to integrate their data, especially from a wide variety of applications. We take care of the ETL for you by automating the creation and management of data replication. Glue ETL offers customer-managed data ingestion.
This week on the keynote stages at AWS re:Invent 2024, you heard from Matt Garman, CEO, AWS, and Swami Sivasubramanian, VP of AI and Data, AWS, speak about the next generation of Amazon SageMaker , the center for all of your data, analytics, and AI. The relationship between analytics and AI is rapidly evolving.
Plug-and-play integration : A seamless, plug-and-play integration between data producers and consumers should facilitate rapid use of new data sets and enable quick proof of concepts, such as in the data science teams. From here, the metadata is published to Amazon DataZone by using AWS Glue Data Catalog.
From the Unified Studio, you can collaborate and build faster using familiar AWS tools for model development, generative AI, data processing, and SQL analytics. You can use a simple visual interface to compose flows that move and transform data and run them on serverless compute. Now you can publish it.
Industry analysts who follow the data and analytics industry tell DataKitchen that they are receiving inquiries about “data fabrics” from enterprise clients on a near-daily basis. Gartner included data fabrics in their top ten trends for data and analytics in 2019. Start with a DataOps Process Fabric.
Data-driven companies sense change through dataanalytics. Analytics tell the story of markets and customers. Analytics enable companies to understand their environment. Companies turn to their data organization to provide the analytics that stimulates creative problem-solving.
Lakehouse allows you to use preferred analytics engines and AI models of your choice with consistent governance across all your data. At re:Invent 2024, we unveiled the next generation of Amazon SageMaker , a unified platform for data, analytics, and AI. Industry-leading price-performance: Amazon Redshift launches RA3.large
If we talk about Big Data, data visualization is crucial to more successfully drive high-level decision making. Big Dataanalytics has immense potential to help companies in decision making and position the company for a realistic future. There is little use for dataanalytics without the right visualization tool.
The important thing to realize is that these problems are not the fault of the people working in the data organization. The dataanalytics lifecycle is a factory, and like other factories, it can be optimized with techniques borrowed from methods like lean manufacturing. Everyone in the industry faces these problems.
AWS Transfer Family seamlessly integrates with other AWS services, automates transfer, and makes sure data is protected with encryption and access controls. The Redshift publish zone is a different set of tables in the same Redshift provisioned cluster. 2 GB into the landing zone daily.
The data fabric architectural approach can simplify data access in an organization and facilitate self-service data consumption at scale. Read: The first capability of a data fabric is a semantic knowledge data catalog, but what are the other 5 core capabilities of a data fabric? 11 May 2021. .
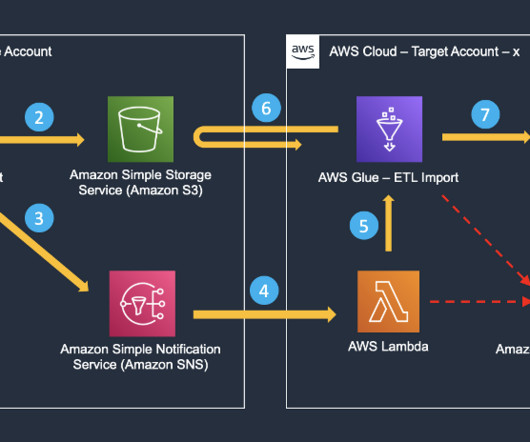
We will partition and format the server access logs with Amazon Web Services (AWS) Glue , a serverless dataintegration service, to generate a catalog for access logs and create dashboards for insights. Both the user data and logs buckets must be in the same AWS Region and owned by the same account. Big Data Architect.
Under the Transparency in Coverage (TCR) rule , hospitals and payors to publish their pricing data in a machine-readable format. The data in the machine-readable files can provide valuable insights to understand the true cost of healthcare services and compare prices and quality across hospitals.
Further, “ML-Augmented dataintegration is making active metadata analysis and semantic knowledge graphs pivotal parts of the data fabric””. If you want to solve interesting problems beyond basic dataanalytics, you are going to need formal semantics and that means schemas. Schemas are powerful.
Deal accelerates insightsoftware’s enterprise position in operational reporting by adding market-leading dataanalytics and integration products including SAP and Oracle ERP reporting solutions. The company’s dataintegration and connectivity solutions help customers better manage distributed data sources across the enterprise.
The data resides on Amazon S3, which reduces the storage costs significantly. Centralized catalog for publisheddata – Multiple producers release data currently governed by their respective entities. For consumer access, a centralized catalog is necessary where producers can publish their data assets.
To share data to our internal consumers, we use AWS Lake Formation with LF-Tags to streamline the process of managing access rights across the organization. Dataintegration workflow A typical dataintegration process consists of ingestion, analysis, and production phases.
The engines must facilitate the advanced dataintegration and metadata data management scenarios where an EKG is used for data fabrics or otherwise serves as a data hub between diverse data and content management systems. Need a reliable and robust RDF graph database for your use case?
published as a special topic article in AI magazine, Volume 43, Issue 1 , Spring 2022. The paper introduces KnowWhereGraph (KWG) as a solution to the ever-growing challenge of integrating heterogeneous data and building services on top of already existing open data. web service/API interfaces and communication protocols).
For those of you who did not attend the summit, we have cited Gartner research as the sessions predominantly reflected the most recent Gartner published papers. 2) Line of business is taking a more active role in data projects. To achieve organization-wide data literacy, a new information management platform must emerge.
In this post, we walk you through the top analytics announcements from re:Invent 2024 and explore how these innovations can help you unlock the full potential of your data. enables you to develop, run, and scale your dataintegration workloads and get insights faster. With AWS Glue 5.0, AWS Glue 5.0 AWS Glue 5.0
Just in 2020, the Centers for Medicare and Medicaid Services (CMS) published a rule for healthcare systems whereby patients, providers, and payers must be able to easily exchange information. For over 20 years , the discussion of how to address this challenge has permeated the industry without a clear resolution.
Datapine – Datapine connects all your data sources in a unified location and creates detailed visualizations to help businesses comprehend their data better. Tableau – A leader in the BI market today, Tableau aids businesses in visualizing and making sense of data. The tool is simple and easy to use.
With the rapid growth of technology, more and more data volume is coming in many different formats—structured, semi-structured, and unstructured. Dataanalytics on operational data at near-real time is becoming a common need. a new version of AWS Glue that accelerates dataintegration workloads in AWS.
It has been well published since the State of DevOps 2019 DORA Metrics were published that with DevOps, companies can deploy software 208 times more often and 106 times faster, recover from incidents 2,604 times faster, and release 7 times fewer defects. Finally, dataintegrity is of paramount importance.
Anwar has over 18 years of experience implementing enterprise business intelligence (BI), dataanalytics and database solutions. He specializes in integration of BI solutions with business applications, helping customers in BI architecture design patterns and best practices.
The Magic Quadrant (MQ) is an established, widely-referenced series of research reports published by the analyst firm Gartner, Inc. The January 2019 “Magic Quadrant for Data Management Solutions for Analytics” provides valuable insights into the status, direction, and players in the DMSA market.
I try to relate as much published research as I can in the time available to draft a response. – In the webinar and Leadership Vision deck for Data and Analytics we called out AI engineering as a big trend. – In the webinar and Leadership Vision deck for Data and Analytics we called out AI engineering as a big trend.
Data Literacy, training, coordination, collaboration 8. Data Management Infrastructure/Data Fabric 5. DataIntegration tactics 4. CDO (data officer) 2. Figure 3: The Data and Analytics (infrastructure) Continuum. This graphic has not been published and in fact is ongoing research.
Datapine – Datapine connects all your data sources in a unified location and creates detailed visualizations to help businesses comprehend their data better. Tableau – A leader in the BI market today, Tableau aids businesses in visualizing and making sense of data. The tool is simple and easy to use.
Organizations across the world are increasingly relying on streaming data, and there is a growing need for real-time dataanalytics, considering the growing velocity and volume of data being collected. Upon success, update the AWS Glue Data Catalog table using the updated schema. page in the GitHub repository. $
The use of Generative AI, LLM and products such as ChatGPT capabilities has been applied to all kinds of industries, from publishing and research to targeted marketing and healthcare. Nothing…and I DO mean NOTHING…is more prominent in technology buzz today than Artificial Intelligence (AI). billion, with the market growing by 31.1%
Processing terabytes or even petabytes of increasing complex omics data generated by NGS platforms has necessitated development of omics informatics. gene expression; microbiome data) and any tabular data (e.g., clinical) using a range of machine learning models.
For this, Cargotec built an Amazon Simple Storage Service (Amazon S3) data lake and cataloged the data assets in AWS Glue Data Catalog. They chose AWS Glue as their preferred dataintegration tool due to its serverless nature, low maintenance, ability to control compute resources in advance, and scale when needed.
Datapine – Datapine connects all your data sources in a unified location and creates detailed visualizations to help businesses comprehend their data better. Tableau – A leader in the BI market today, Tableau aids businesses in visualizing and making sense of data. The tool is simple and easy to use.
Datapine – Datapine connects all your data sources in a unified location and creates detailed visualizations to help businesses comprehend their data better. Tableau – A leader in the BI market today, Tableau aids businesses in visualizing and making sense of data. The tool is simple and easy to use.
Tableau is more suitable for experienced data analysts to operate. It is easier for those with experience in dataanalytics to convert the data into visual reports. But beginners may feel overwhelmed by the difficulty of learning the operations before visualizing data. Data sources supported in FineReport.
Additionally, fostering a culture of data literacy by training teams on data standards and best practices ensures that everyone contributes to maintaining a high standard of dataintegrity, positioning the organization for long-term success. The Simba Story: Advancing Leadership in Data Connectivity Download Now 4.
And for financial data, integrate and pull directly from your existing ERP to create reports. Assisting with the creation and dissemination of board reports is just one aspect that board management software covers. Users can also often schedule meetings, share minutes, and provide insights beyond what’s on the page.
A data pipeline is a series of processes that move raw data from one or more sources to one or more destinations, often transforming and processing the data along the way. Data pipelines support data science and business intelligence projects by providing data engineers with high-quality, consistent, and easily accessible data.
Organizations are promised a ‘one size fits all’ tool that will allow users to ‘drag n drop’ their way to data fluency. Some organizations tightly control access to their data, which can frustrate users who want to run their own queries to combine data sets or create dashboards from a single set of data.
Certent Disclosure Management will help you avoid: Numbers or facts within final reports being out of date before the report is even published. Say goodbye to the struggles and pains you’ve had closing out the end the year.
By making data-driven decisions like this, product managers can optimize the user experience and ultimately drive greater success for their product. Embedded Analytics Defined Embedded analytics is the integration of analytical capabilities and data visualizations into another software application.
We organize all of the trending information in your field so you don't have to. Join 42,000+ users and stay up to date on the latest articles your peers are reading.
You know about us, now we want to get to know you!
Let's personalize your content
Let's get even more personalized
We recognize your account from another site in our network, please click 'Send Email' below to continue with verifying your account and setting a password.


Let's personalize your content