This site uses cookies to improve your experience. To help us insure we adhere to various privacy regulations, please select your country/region of residence. If you do not select a country, we will assume you are from the United States. Select your Cookie Settings or view our Privacy Policy and Terms of Use.
Cookie Settings
Cookies and similar technologies are used on this website for proper function of the website, for tracking performance analytics and for marketing purposes. We and some of our third-party providers may use cookie data for various purposes. Please review the cookie settings below and choose your preference.
Used for the proper function of the website
Used for monitoring website traffic and interactions
Cookie Settings
Cookies and similar technologies are used on this website for proper function of the website, for tracking performance analytics and for marketing purposes. We and some of our third-party providers may use cookie data for various purposes. Please review the cookie settings below and choose your preference.
Strictly Necessary: Used for the proper function of the website
Performance/Analytics: Used for monitoring website traffic and interactions
Serving as a central, interactive hub for a host of essential fiscal information, CFO dashboards host dynamic financial KPIs and intuitive analytical tools, as well as consolidate data in a way that is digestible and improves the decision-making process. Top 7 CFO Dashboard KPIs & Metrics Explained.
DataOps needs a directed graph-based workflow that contains all the data access, integration, model and visualization steps in the dataanalytic production process. It orchestrates complex pipelines, toolchains, and tests across teams, locations, and data centers. Amaterasu — is a deployment tool for data pipelines.
By acquiring a deep working understanding of data science and its many business intelligence branches, you stand to gain an all-important competitive edge that will help to position your business as a leader in its field. Data science, also known as data-driven science, covers an incredibly broad spectrum.
It is possible to structure data across a broad range of spreadsheets, but the final result can be more confusing than productive. By using an online dashboard , you will be able to gain access to dynamic metrics and data in a way that’s digestible, actionable, and accurate. Primary KPIs: Treatment Costs. ER Wait Time.
Additionally, CRM dashboard tools provide access to insights that offer a concise snapshot of your customer-driven performance and activities through a range of features and functionalities empowered by online data visualization tools. You may remember us mentioning data storytelling earlier. Let’s look at this in more detail.
With so much data and so little time, knowing how to collect, curate, organize, and make sense of all of this potentially business-boosting information can be a minefield – but online data analysis is the solution. This is one of the most important dataanalytics techniques as it will shape the very foundations of your success.
Vertical SaaS also provides the following benefits: Customer intelligence: Enables businesses to obtain industry-specific customer data and intelligence, which plays a critical role in gaining customer-focused insights. If you’re looking to improve your dataanalytics processes, in particular, unbundling is unlikely to be the answer.
Monitor the solution To maintain the health of the log ingestion pipeline, there are several key areas to monitor: Kinesis Data Streams metrics – You should monitor the following metrics: FailedRecords – Indicates an issue in CloudWatch subscription filters writing to the Kinesis data stream.
But there’s a host of new challenges when it comes to managing AI projects: more unknowns, non-deterministic outcomes, new infrastructures, new processes and new tools. Many consumer internet companies invest heavily in analytics infrastructure, instrumenting their online product experience to measure and improve user retention.
The balance sheet gives an overview of the main metrics which can easily define trends and the way company assets are being managed. Our procurement dashboard above is not only visually balanced but also offers a clear-cut snapshot of every vital metric you need to improve your procurement processes at a glance. It doesn’t stop here.
In 2022, data organizations will institute robust automated processes around their AI systems to make them more accountable to stakeholders. Quality test suites will enforce “equity,” like any other performance metric. Most organizations run the data factory using manual labor. Rise of the DataOps Engineer.
Without big dataanalytics, companies are blind and deaf, wandering out onto the Web like deer on a freeway. We are indeed living in a time rich in invaluable digital data. Companies that use dataanalytics are five times more likely to make faster decisions, based on a survey conducted by Bain & Company.
The Link Between Data And Business Performance. In today’s information-rich age, there is a tangible link between online data analysis and business performance. According to Accenture, 89% of business innovators believe that that big dataanalytics will revolutionize business operations in the same way as the World Wide Web.
In addition to real-time analytics and visualization, the data needs to be shared for long-term dataanalytics and machine learning applications. The applications are hosted in dedicated AWS accounts and require a BI dashboard and reporting services based on Tableau.
One example of this trend is by using analytics to measure the engagement of Instagram stories to get customers to interact more frequently. DataAnalytics is the Backbone of Instagram Marketing Instagram CEO Kevin Systrom has stated that Instagram is in the process of becoming a big data company. And guess what?
A social media report offers a means of extracting value from data based on various social networks (Facebook, Twitter, LinkedIn, YouTube, etc.) and metrics (follows, likes, reach, growth, awareness, post performance, engagements, etc.) With the help of an online data analysis tool , this targeting can be built up significantly.
Now that you understand a clearly defined dashboard meaning, let’s move onto one of the primary functions of data dashboards: answering critical business questions. As mentioned earlier, a data dashboard has the ability to answer a host of business-related questions based on your specific goals, aims, and strategies.
“Without big dataanalytics, companies are blind and deaf, wandering out onto the web like deer on a freeway.” – Geoffrey Moore. And, as a business, if you use your data wisely, you stand to reap great rewards. Data brings a wealth of invaluable insights that could significantly boost the growth and evolution of your business.
Previously, we discussed the top 19 big data books you need to read, followed by our rundown of the world’s top business intelligence books as well as our list of the best SQL books for beginners and intermediates. Data visualization, or ‘data viz’ as it’s commonly known, is the graphic presentation of data.
It offers ease of access through mobile devices, on the go, with critical metrics displayed at-a-glance. Regardless of your industry or sector, digital transformation means that utilizing digital and online data visualization to enhance your business operations is no longer a luxury – it’s now a necessity if you want to survive.
For sectors such as industrial manufacturing and energy distribution, metering, and storage, embracing artificial intelligence (AI) and generative AI (GenAI) along with real-time dataanalytics, instrumentation, automation, and other advanced technologies is the key to meeting the demands of an evolving marketplace, but it’s not without risks.
Dataanalytics technology has changed many aspects of the modern workplace. A growing number of companies are using data to make more informed hiring decisions , track payroll issues and resolve internal problems. Keep reading to learn more about the benefits of a data-driven approach to conducting employee performance reviews.
Load balancing challenges with operating custom stream processing applications Customers processing real-time data streams typically use multiple compute hosts such as Amazon Elastic Compute Cloud (Amazon EC2) to handle the high throughput in parallel. Priyanka Chaudhary is a Senior Solutions Architect and dataanalytics specialist.
Together with price-performance, Amazon Redshift offers capabilities such as serverless architecture, machine learning integration within your data warehouse and secure data sharing across the organization. dbt Cloud is a hosted service that helps data teams productionize dbt deployments. or a later version) database.
You need to determine if you are going with an on-premise or cloud-hosted strategy. These basic steps will enable you to deliver agile dataanalytics and BI methodology into practice, no matter the size of your company. Top 10 Tips For Agile BI & Analytics Development. Construction Iterations.
By squeezing every last drop of value from your business’s most valuable data, you will increase your efficiency while boosting your bottom line. With dynamic features and a host of interactive insights, a business dashboard is the key to a more prosperous, intelligent business future. That’s where corporate dashboards come in.
“BI is about providing the right data at the right time to the right people so that they can take the right decisions” – Nic Smith. Dataanalytics isn’t just for the Big Guys anymore; it’s accessible to ventures, organizations, and businesses of all shapes, sizes, and sectors.
Moreover, AI pairs perfectly with DataAnalytics which make room for vastly improved blogging efforts. One such example is Grammarly that comes forth as an AI-powered language and grammar checker that can provide insights based on the tone of the conversation and a host of other metrics.
With a host of interactive sales graphs and specialized charts, this sales graph template is a shining example of how to present sales data for your business. 62% of retail businesses report a clear competitive advantage by leveraging information and analytics as a core part of their business activities.
In this post, we discuss ways to modernize your legacy, on-premises, real-time analytics architecture to build serverless dataanalytics solutions on AWS using Amazon Managed Service for Apache Flink. HandleTime – This customer service metric measures the length of a customer’s call.
Here we explore 13 BI examples based on real-life case studies, scenarios, data, and discoveries. These business intelligence examples will showcase the power and potential of big dataanalytics in the modern age and how it can make your venture smarter, stronger, more scalable and more successful. 4) Increasing Sales.
This is one of the most developed business intelligence tools in the market that comes packed with high-end dataanalytics and visualization features. This high-end data visualization makes data exploration more accessible to end-users. It also comes with data caching capabilities that enable fast querying.
Dashboards are hosted software applications that automatically pull together available data into charts and graphs that give a sense of the immediate state of the company. The potential use cases for BI extend beyond the typical business performance metrics of improved sales and reduced costs.
Exclusive Bonus Content: Ready to use dataanalytics in your restaurant? Get our free bite-sized summary for increasing your profits through data! By managing your information with data analysis tools , you stand to sharpen your competitive edge, increase your profitability, boost profit margins, and grow your customer base.
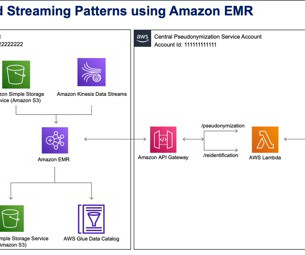
The account on the right hosts the pseudonymization service, which you can deploy using the instructions provided in the Part 1 of this series. In the following examples, we analyze three important Lambda metrics for the pseudonymization service: Invocations , ConcurrentExecutions , and Duration. GB 1.467.000 – 0 = 1.467.000 B 0.95
By treating the data as a product, the outcome is a reusable asset that outlives a project and meets the needs of the enterprise consumer. Consumer feedback and demand drives creation and maintenance of the data product. For instance, one enhancement involves integrating cross-functional squads to support data literacy.
After the Pricing Summary Report is generated and stored in Amazon S3, the company can use AWS analytics services to generate interactive BI dashboards and run one-time queries on the report. This involves creating VPC endpoints in both the AWS and Snowflake VPCs, making sure data transfer remains within the AWS network.
Johansen spoke to Dan Roberts, host of the Tech Whisperers podcast, during CIO’s recent Future of Work Summit about the art of forecasting, not predicting, and remaining agile through transitions that test the balance of humanity and technology. On metrics: It’s been said a lot that data is the new oil.
You can install and configure the CloudWatch agent to collect system and application logs from EC2 instances, on-premises hosts, and containerized applications. Conclusion Now that you have completed the steps in this walkthrough, you have the CloudWatch agent running on your cluster hosts and configured to push EMR step logs to CloudWatch.
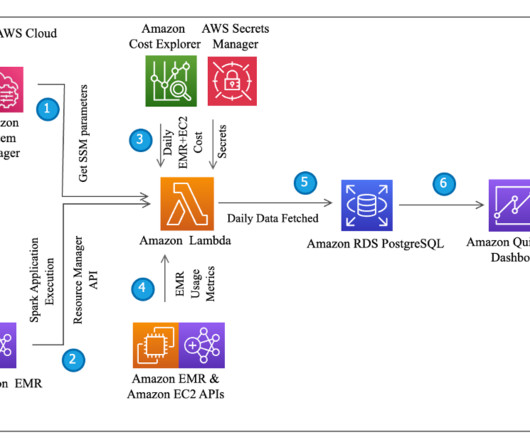
The function captures usage and cost metrics, which are subsequently stored in Amazon Relational Database Service (Amazon RDS) tables. The data stored in the RDS tables is then queried to derive chargeback figures and generate reporting trends using Amazon QuickSight. tbl_applicationlogs – RDS table to store EMR application run logs.
Args: region (str): AWS region where the MWAA environment is hosted. Args: region (str): AWS region where the MWAA environment is hosted. Amazon MWAA provides web server container metrics in the AWS/MWAA service namespace in Amazon CloudWatch , allowing you to monitor the web server performance.
AUSTIN, TEXAS ( PRWEB ) MAY 12, 2022 InsightOut, a dataanalytics and management platform from Treehouse Technology Group, today announced a partnership with Sage, the leader in accounting, financial, HR, and payroll technology for small and medium-sized businesses (SMBs). Learn more here.
For Host , enter events.PagerDuty.com. Configure OpenSearch Service alerts to send notifications to PagerDuty We can monitor OpenSearch cluster health in two different ways: Using the OpenSearch Dashboard alerting plugin by setting up a per cluster metrics monitor. For Monitor type , select Per cluster metrics monitor.
Without real-time insight into their data, businesses remain reactive, miss strategic growth opportunities, lose their competitive edge, fail to take advantage of cost savings options, don’t ensure customer satisfaction… the list goes on. Ensure data literacy. For decades now, dataanalytics has been considered a segregated task.
We organize all of the trending information in your field so you don't have to. Join 42,000+ users and stay up to date on the latest articles your peers are reading.
You know about us, now we want to get to know you!
Let's personalize your content
Let's get even more personalized
We recognize your account from another site in our network, please click 'Send Email' below to continue with verifying your account and setting a password.


Let's personalize your content