This site uses cookies to improve your experience. To help us insure we adhere to various privacy regulations, please select your country/region of residence. If you do not select a country, we will assume you are from the United States. Select your Cookie Settings or view our Privacy Policy and Terms of Use.
Cookie Settings
Cookies and similar technologies are used on this website for proper function of the website, for tracking performance analytics and for marketing purposes. We and some of our third-party providers may use cookie data for various purposes. Please review the cookie settings below and choose your preference.
Used for the proper function of the website
Used for monitoring website traffic and interactions
Cookie Settings
Cookies and similar technologies are used on this website for proper function of the website, for tracking performance analytics and for marketing purposes. We and some of our third-party providers may use cookie data for various purposes. Please review the cookie settings below and choose your preference.
Strictly Necessary: Used for the proper function of the website
Performance/Analytics: Used for monitoring website traffic and interactions
2) How To Measure Productivity? For years, businesses have experimented and narrowed down the most effective measurements for productivity. Your Chance: Want to test a professional KPI tracking software? Use our 14-day free trial and start measuring your productivity today! How To Measure Productivity?
By articulating fitness functions automated tests tied to specific quality attributes like reliability, security or performance teams can visualize and measure system qualities that align with business goals. Experimentation: The innovation zone Progressive cities designate innovation districts where new ideas can be tested safely.
The way data is collected online and what happens to it is a much-scrutinized issue (and rightly so). Digital datacollection is also exceedingly complex, perhaps a reflection of the organic nature, and subsequent explosion, of the internet. Web DataCollection Context: Cookies and Tools.
Yet, before any serious data interpretation inquiry can begin, it should be understood that visual presentations of data findings are irrelevant unless a sound decision is made regarding scales of measurement. For a more in-depth review of scales of measurement, read our article on data analysis questions.
By implementing the right reporting tools and understanding how to analyze as well as to measure your data accurately, you will be able to make the kind of data driven decisions that will drive your business forward. What Is Data Driven Decision Making? Quantitative data analysis focuses on numbers and statistics.
The process helps businesses and decision-makers measure the success of their strategies toward achieving company goals. How does Company A measure the success of each individual effort so that it can isolate strengths and weaknesses? Key performance indicators enable businesses to measure their own ability to set and achieve goals.
In addition, the Research PM defines and measures the lifecycle of each research product that they support. The foundation of any data product consists of “solid data infrastructure, including datacollection, data storage, data pipelines, data preparation, and traditional analytics.”
Businesses already have a wealth of data but understanding your business will help you identify a data need – what kind of data your business needs to collect and if it collects too much or too little of certain data. Collecting too much data would be overwhelming and too little – inefficient.
Your Chance: Want to test a market research reporting software? An effective modern means of extracting real value from your research results such as brand analysis, market research reports present and arrange data in a way that is digestible and logical in equal measures through professional online reporting software and tools.
The big data market is expected to exceed $68 billion in value by 2025 , a testament to its growing value and necessity across industries. According to studies, 92% of data leaders say their businesses saw measurable value from their data and analytics investments.
The problems with consent to datacollection are much deeper. It comes from medicine and the social sciences, in which consenting to datacollection and to being a research subject has a substantial history. We really don't know how that data is used, or might be used, or could be used in the future.
The model outputs produced by the same code will vary with changes to things like the size of the training data (number of labeled examples), network training parameters, and training run time. This has serious implications for software testing, versioning, deployment, and other core development processes.
We are far too enamored with datacollection and reporting the standard metrics we love because others love them because someone else said they were nice so many years ago. Sometimes, we escape the clutches of this sub optimal existence and do pick good metrics or engage in simple A/B testing. Testing out a new feature.
In the process, we will use an online data visualization software that lets us interact with, and drill deeper into bits and pieces of relevant data. Your Chance: Want to test professional business reporting software? Your Chance: Want to test professional business reporting software? Let’s get started.
So we really prioritized the data that we thought had the biggest chance of delivering success in the end. Chapin also mentioned that measuring cycle time and benchmarking metrics upfront was absolutely critical. “It DataOps Enables Your Data Mesh or Data Fabric. Design for measurability.
The alternative to synthetic data is to manually anonymize and de-identify data sets, but this requires more time and effort and has a higher error rate. The European AI Act also talks about synthetic data, citing them as a possible measure to mitigate the risks associated with the use of personal data for training AI systems.
How to measure your data analytics team? So it’s Monday, and you lead a data analytics team of perhaps 30 people. Like most leaders of data analytic teams, you have been doing very little to quantify your team’s success. The Active Data Ratio metric determines the percentage of datasets that deliver value.
Because things are changing and becoming more competitive in every sector of business, the benefits of business intelligence and proper use of data analytics are key to outperforming the competition. Everything is being tested, and then the campaigns that succeed get more money put into them, while the others aren’t repeated.
Organizations are able to monitor integrity, quality drift, performance trends, real-time demand, SLA (service level agreement) compliance metrics, and anomalous behaviors (in devices, applications, and networks) to provide timely alerting, early warnings, and other confidence measures. As Splunk says, “Automate so you can innovate.”
Business analytics can help you improve operational efficiency, better understand your customers, project future outcomes, glean insights to aid in decision-making, measure performance, drive growth, discover hidden trends, generate leads, and scale your business in the right direction, according to digital skills training company Simplilearn.
You just have to have the right mental model (see Seth Godin above) and you have to… wait for it… wait for it… measure everything you do! For everything you do it is important to measure your effectiveness of all three phases of your effort: Acquisition. You’re trying to measure how well you are doing to: Send emails.
Most data management conferences and forums focus on AI, governance and security, with little emphasis on ESG-related data strategies. If sustainability-related data projects fail to demonstrate a clear financial impact, they risk being deprioritized in favor of more immediate business concerns.
Methodologies in Deploying Data Analytics The application of data analytics in fast food legal cases requires a thorough understanding of the methodologies involved. This involves datacollection , data cleaning, data analysis, and data interpretation.
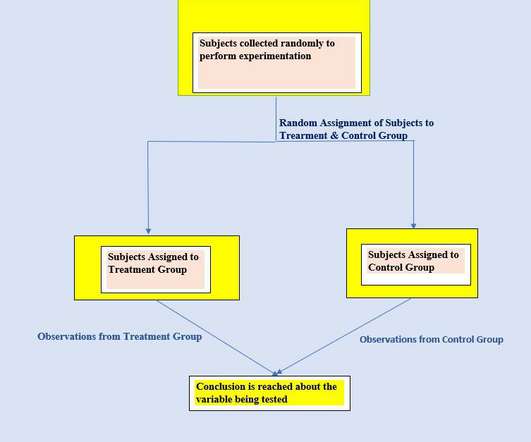
Researchers/ scientists perform experiments to validate their hypothesis/ statements or to test a new product. Bias ( syatematic unfairness in datacollection ) can be a potential problem in experiments and we need to take it into account while designing experiments. For eg: you measure the blood pressure of a person.
The organization functions off a clearly defined Digital Marketing & Measurement Model. #1. Remember none of these jobs will do any datacollection/IT work, even in medium-sized companies.) More on the Digital Marketing & Measurement Model, DMMM, in #2 below.). Four Useless KPI Measurement Techniques. #9:
Architectural Limitations: Data and process architectures that are outdated, inadequate, or fail to scale with growing data volumes can become a significant bottleneck, leading to quality issues and inefficiencies. Elevated Error Rates: An increase in the frequency and severity of data errors is a red flag that should not be ignored.
CIOs, as well as CTOs, should advocate for measuring how humane their AI-powered services are because, typically, we’re more prone to improving what we decided to measure, Jain adds. This means implementing stringent data protection measures and being transparent about data usage.”
They have kindly added one more question to the mix that will help measure customer satisfaction! Your data is yours, there is a very strict privacy policy that governs the storage and access of the datacollected. Tools and features that, I humbly, believe further the cause of measurement and understanding of data.
For the modern digital organization, the proof of any inference (that drives decisions) should be in the data! Rich and diverse datacollections enable more accurate and trustworthy conclusions. In “big data language”, we are talking about one of the 3 V’s of big data: big data Variety!
What is data analytics? One of the most buzzing terminologies of this decade has got to be “data analytics.” Companies generate unlimited data every day, and there is no end to the datacollected over time. Companies need all of this data in a structured manner to improve their decision—making capabilities.
The three biggest enemies to user onboarding are the lack of data analysis, datacollection, and the wrong amount of information. Unfortunately, many businesses worldwide are not doing a good job collectingdata and thus, fail to enhance customer relationships. Where do they live? How often do they go for a coffee?
Prescriptive data analytics: It is used to predict outcomes and necessary subsequent actions by combining the features of big data and AI. They can be again classified as random testing and optimization. This includes studying factors like test scores, teacher performances, and graduation rates.
By PATRICK RILEY For a number of years, I led the data science team for Google Search logs. We were often asked to make sense of confusing results, measure new phenomena from logged behavior, validate analyses done by others, and interpret metrics of user behavior. Description : What’s the objective interpretation of this data?
Collecting Relevant Data for Conversion Rate Optimization Here is some vital data that e-commerce businesses need to collect to improve their conversion rates. Identifying Key Metrics for Conversion Rate Optimization Datacollection and analysis are both essential processes for optimizing your conversion rate.
Hot Melt Optimization employs a proprietary datacollection method using proprietary sensors on the assembly line, which, when combined with Microsoft’s predictive analytics and Azure cloud for manufacturing, enables P&G to produce perfect diapers by reducing loss due to damage during the manufacturing process.
These measures will drive decarbonization across the value chain and give CIOs the opportunity to leverage their expertise and build resiliency throughout their organizations. This technology has attracted top clients for Climeworks, who are exploring its potential uses to deliver carbon removals at scale, with potential global impact.
Yehoshua Coren: Best ways to measure user behavior in a multi-touch, multi-device digital world. What's possible to measure. What's not possible to measure. We all have smart phones, laptops, tablets and soon Smart TVs – but most of our measurements are usually done in Cookies that are device/browser specific.
in partnership with IBM and other organizations is in the process of conducting performance tests on the world’s first autonomous ship and is due to set sail for its first transatlantic voyage this spring. I think you’ll see the parallels with Decision Management as the story unfolds. Marine AI—based in Plymouth, U.K.—in
(3) Data Product Ecosystem To enable the flow of information and the creation and sharing of data products, you need standards, tools, and processes in place. A good example is what Apple did with the App Store in creating a platform and standards by which apps are created, tested, distributed, and reviewed.
This post will demonstrate how ActionIQ built a connector for Amazon Redshift to tap directly into your data warehouse and deliver a secure, zero-copy CDP. It will cover how you can get started with building a truly composable CDP with Amazon Redshift—from the solution architecture to setting up and testing the connector.
Larger is Better involves a “lower specification limit,” such as test scores — where the target is 100%. Measure performance of the current process by establishing a datacollection plan to determine defects and gather metrics. Improve the process by eliminating root causes of defects through innovative solutions.
communication reliability, which supports minute-level datacollection and second-level control for low-voltage transparency. It was the solution of choice to achieve an observable, measurable, adjustable, controllable and traceable low-voltage side. HPLC can deliver 99.9%
DataCollection Request – A sentence requesting data from the customer. But we have more than just case references to measure knowledge article popularity, we can also pull in another data source, customer views. Testing the Results. The first tests came during the Spark ML model training.
Big Datacollection at scale is increasing across industries, presenting opportunities for companies to develop AI models and leverage insights from that data. Regulation: Lawmakers worldwide are considering privacy legislation and other rules that could limit the scope of datacollection and AI use cases.
We organize all of the trending information in your field so you don't have to. Join 42,000+ users and stay up to date on the latest articles your peers are reading.
You know about us, now we want to get to know you!
Let's personalize your content
Let's get even more personalized
We recognize your account from another site in our network, please click 'Send Email' below to continue with verifying your account and setting a password.


Let's personalize your content