This site uses cookies to improve your experience. To help us insure we adhere to various privacy regulations, please select your country/region of residence. If you do not select a country, we will assume you are from the United States. Select your Cookie Settings or view our Privacy Policy and Terms of Use.
Cookie Settings
Cookies and similar technologies are used on this website for proper function of the website, for tracking performance analytics and for marketing purposes. We and some of our third-party providers may use cookie data for various purposes. Please review the cookie settings below and choose your preference.
Used for the proper function of the website
Used for monitoring website traffic and interactions
Cookie Settings
Cookies and similar technologies are used on this website for proper function of the website, for tracking performance analytics and for marketing purposes. We and some of our third-party providers may use cookie data for various purposes. Please review the cookie settings below and choose your preference.
Strictly Necessary: Used for the proper function of the website
Performance/Analytics: Used for monitoring website traffic and interactions
As someone deeply involved in shaping data strategy, governance and analytics for organizations, Im constantly working on everything from defining data vision to building high-performing data teams. My work centers around enabling businesses to leverage data for better decision-making and driving impactful change.
There are other dimensions of analytics that tend to focus on hindsight for business reporting and causal analysis – these are descriptive and diagnostic analytics, respectively, which are primarily reactive applications, mostly explanatory and investigatory, not necessarily actionable. This is predictive power discovery.
Using business intelligence and analytics effectively is the crucial difference between companies that succeed and companies that fail in the modern environment. The main use of business intelligence is to help business units, managers, top executives, and other operational workers make better-informed decisions backed up with accurate data.
Where descriptiveanalytics reveals what has happened in the past, prescriptive analytics delivers insight into optimizing future decisions. As data-driven organizations mature, they will begin to apply prescriptive analytics. by Jen Underwood. Read More.
Think your customers will pay more for data visualizations in your application? Discover which features will differentiate your application and maximize the ROI of your embedded analytics. Brought to you by Logi Analytics. Five years ago they may have. But today, dashboards and visualizations have become table stakes.
If you do an internet search for ‘data-driven disruption’ you can find articles about almost every industry being disrupted by digitalisation and new applications of data. While there are instances of data-driven efforts in the nonprofit sector, they are not as widespread as they can be.
BI tools access and analyze data sets and present analytical findings in reports, summaries, dashboards, graphs, charts, and maps to provide users with detailed intelligence about the state of the business. Benefits of BI BI helps business decision-makers get the information they need to make informed decisions.
Everyone wants to get more out of their data, but how exactly to do that can leave you scratching your head. Our BI Best Practices demystify the analytics world and empower you with actionable how-to guidance. Data visualization: painting a picture of your data. Thomas, and Kristin A.
There is no disputing that dataanalytics is a huge gamechanger for companies all over the world. Global businesses are projected to spend over $684 billion on big data by 2030. There are many ways that companies are using big data to boost their profitability. One of the most important is in the field of marketing.
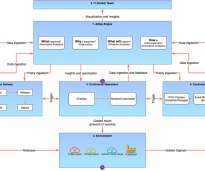
Moreover, there are often duplicate events due to full-stack level observability and these events result in data silos. Both the continuous delivery tooling and the continuous operations tooling ingest all the data into the AIOps engine shown at the top (box 7: AIOps Engine). Predictive analytics to show what will happen next.
Co-chair Paco Nathan provides highlights of Rev 2 , a data science leaders summit. We held Rev 2 May 23-24 in NYC, as the place where “data science leaders and their teams come to learn from each other.” Nick Elprin, CEO and co-founder of Domino Data Lab. First item on our checklist: did Rev 2 address how to lead data teams?
During this period, those working for each city’s Organising Committee for the Olympic Games (OCOG) collect a huge amount of data about the planning and delivery of the Games. At the Information, Knowledge, and Games Learning (IKL) unit, we anticipate collecting about 1TB of data from primary sources.
DDPs accomplish this by providing a suite of capabilities that enable business subject-matter experts to define decision logic, incorporate data-driven decision intelligence technologies such as machine learning (ML), govern change, and deploy digital decisions within business applications. Write different rules for each category.
Ever since the digitization of casinos, casino managers are being exposed to a great deal of data. Hidden tangled within this sea of data lie many insights, which can open up new opportunities for growth and revenue. This is what makes the casino industry a great use case for prescriptive analytics technologies and applications.
Producing insights from raw data is a time-consuming process. Predictive modeling efforts rely on dataset profiles , whether consisting of summary statistics or descriptive charts. The Importance of Exploratory Analytics in the Data Science Lifecycle. For one, Python remains the leading language for data science research.
You must be tired of continuously hearing quotes like, ‘data is the new oil’ and what not. Combined, it has come to a point where dataanalytics is your safety net first, and business driver second. These industries accumulate ridiculous amounts of data on a daily basis. AI Adoption and Data Strategy. Source: TCS).
Ever since the digitization of casinos, casino managers are being exposed to a great deal of data. Hidden tangled within this sea of data lie many insights, which can open up new opportunities for growth and revenue. This is what makes the casino industry a great use case for prescriptive analytics technologies and applications.
You may be interested to know that TechJury reports seven out of ten businesses rate data discovery as very important, and that the top three business intelligence trends are data visualization, data quality management and self-service business intelligence. or What is happening? And that is exactly what is happening!
Alation is excited to unveil Alation Connected Sheets , a new product that brings trusted, fresh data directly to spreadsheet users. Now, “spreadsheet jockeys” can pull the most current, compliant data directly from a range of cloud sources, without having to know SQL or depend on a data team to deliver it.
Le aziende italiane investono in infrastrutture, software e servizi per la gestione e l’analisi dei dati (+18% nel 2023, pari a 2,85 miliardi di euro, secondo l’Osservatorio Big Data & Business Analytics della School of Management del Politecnico di Milano), ma quante sono giunte alla data maturity?
Rapid technological advancements and extensive networking have propelled the evolution of dataanalytics, fundamentally reshaping decision-making practices across various sectors. In this landscape, data analysts assume a pivotal role, tasked with interpreting data to drive informed decision-making.
As the world becomes increasingly digitized, the amount of data being generated on a daily basis is growing at an unprecedented rate. This has led to the emergence of the field of Big Data, which refers to the collection, processing, and analysis of vast amounts of data. What is Big Data? What is Big Data?
In Prioritizing AI investments: Balancing short-term gains with long-term vision , I addressed the foundational role of data trust in crafting a viable AI investment strategy. So why would any organization that considers a decision critical use business intelligence data to make that decision?
By leveraging data analysis to solve high-value business problems, they will become more efficient. This is in contrast to traditional BI, which extracts insight from data outside of the app. that gathers data from many sources. These tools prep that data for analysis and then provide reporting on it from a central viewpoint.
We organize all of the trending information in your field so you don't have to. Join 42,000+ users and stay up to date on the latest articles your peers are reading.
You know about us, now we want to get to know you!
Let's personalize your content
Let's get even more personalized
We recognize your account from another site in our network, please click 'Send Email' below to continue with verifying your account and setting a password.


Let's personalize your content