Remove Data-driven Remove Interactive Remove Visualization
article thumbnail

Interactive Plots in Python with Plotly: A complete Guide

Analytics Vidhya

This article was published as a part of the Data Science Blogathon Introduction to Data Visualization Plotting and data representation is an important part of the data-driven decision-making process and the whole data science roadmap. The visual representation of data makes understanding […].


article thumbnail

Open-Source BI Tool Metabase for Data Visualization and Analytics

Analytics Vidhya

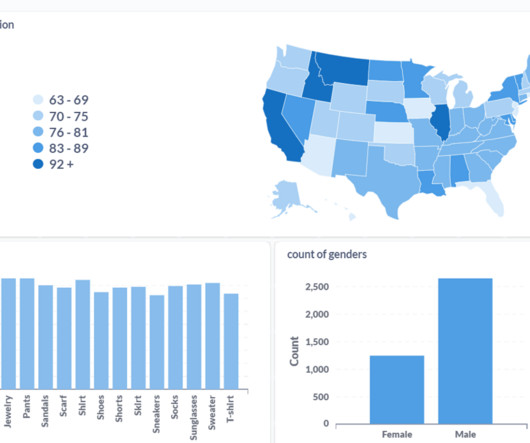
Introduction Are you a passionate data professional exploring new tools? Try Metabase, an open-source Business Intelligence (BI) tool for creating interactive dashboards from large datasets. In today’s data-driven world, BI platforms like Metabase are essential for extracting insights and facilitating informed decision-making.
Insiders

Sign Up for our Newsletter

This site is protected by reCAPTCHA and the Google Privacy Policy and Terms of Service apply.

article thumbnail

Top 20 Data Visualization Examples

Analytics Vidhya

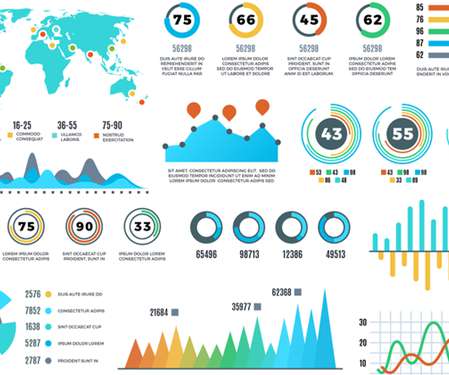
In today’s data-driven world, the quote holds more value than ever. Data visualization is an art that goes beyond numbers and statistics, […] The post Top 20 Data Visualization Examples appeared first on Analytics Vidhya. .” Have you ever wondered why is that?

article thumbnail

Why Data Driven Decision Making is Your Path To Business Success

datapine

The term ‘big data’ alone has become something of a buzzword in recent times – and for good reason. By implementing the right reporting tools and understanding how to analyze as well as to measure your data accurately, you will be able to make the kind of data driven decisions that will drive your business forward.

article thumbnail

Monetizing Analytics Features: Why Data Visualizations Will Never Be Enough

Think your customers will pay more for data visualizations in your application? But today, dashboards and visualizations have become table stakes. Five years ago they may have. Discover which features will differentiate your application and maximize the ROI of your embedded analytics. Brought to you by Logi Analytics.

article thumbnail

The Top 20 Data Visualization Books That Should Be On Your Bookshelf

datapine

Previously, we discussed the top 19 big data books you need to read, followed by our rundown of the world’s top business intelligence books as well as our list of the best SQL books for beginners and intermediates. Data visualization, or ‘data viz’ as it’s commonly known, is the graphic presentation of data.

article thumbnail

Move Beyond Excel, PowerPoint And Static Business Reporting with Powerful Interactive Dashboards

datapine

Visualizing the data and interacting on a single screen is no longer a luxury but a business necessity. That’s why we welcome you to the world of interactive dashboards. Your Chance: Want to test interactive dashboard software for free? Benefit from amazing interactive dashboards! Let’s get started.