This site uses cookies to improve your experience. To help us insure we adhere to various privacy regulations, please select your country/region of residence. If you do not select a country, we will assume you are from the United States. Select your Cookie Settings or view our Privacy Policy and Terms of Use.
Cookie Settings
Cookies and similar technologies are used on this website for proper function of the website, for tracking performance analytics and for marketing purposes. We and some of our third-party providers may use cookie data for various purposes. Please review the cookie settings below and choose your preference.
Used for the proper function of the website
Used for monitoring website traffic and interactions
Cookie Settings
Cookies and similar technologies are used on this website for proper function of the website, for tracking performance analytics and for marketing purposes. We and some of our third-party providers may use cookie data for various purposes. Please review the cookie settings below and choose your preference.
Strictly Necessary: Used for the proper function of the website
Performance/Analytics: Used for monitoring website traffic and interactions
For container terminal operators, data-driven decision-making and efficient data sharing are vital to optimizing operations and boosting supply chain efficiency. Together, these capabilities enable terminal operators to enhance efficiency and competitiveness in an industry that is increasingly datadriven.
I recently saw an informal online survey that asked users which types of data (tabular, text, images, or “other”) are being used in their organization’s analytics applications. The results showed that (among those surveyed) approximately 90% of enterprise analytics applications are being built on tabular data.
Untapped data, if mined, represents tremendous potential for your organization. While there has been a lot of talk about big data over the years, the real hero in unlocking the value of enterprise data is metadata , or the data about the data. Metadata Is the Heart of Data Intelligence.
We’re dealing with data day in and day out, but if isn’t accurate then it’s all for nothing!” Steve needed a robust and automated metadata management solution as part of his organization’s data governance strategy. Enterprise data governance. Metadata in data governance.
Amazon Redshift , launched in 2013, has undergone significant evolution since its inception, allowing customers to expand the horizons of data warehousing and SQL analytics. Industry-leading price-performance Amazon Redshift offers up to three times better price-performance than alternative cloud data warehouses.
Q: Is data modeling cool again? In today’s fast-paced digital landscape, data reigns supreme. The data-driven enterprise relies on accurate, accessible, and actionable information to make strategic decisions and drive innovation. A: It always was and is getting cooler!!
We need to do more than automate model building with autoML; we need to automate tasks at every stage of the data pipeline. In a previous post , we talked about applications of machine learning (ML) to software development, which included a tour through sample tools in data science and for managing data infrastructure.
If you’re serious about a data-driven strategy , you’re going to need a data catalog. Organizations need a data catalog because it enables them to create a seamless way for employees to access and consume data and business assets in an organized manner. Three Types of Metadata in a Data Catalog.
Analytics remained one of the key focus areas this year, with significant updates and innovations aimed at helping businesses harness their data more efficiently and accelerate insights. From enhancing data lakes to empowering AI-driven analytics, AWS unveiled new tools and services that are set to shape the future of data and analytics.
Organizational data is often fragmented across multiple lines of business, leading to inconsistent and sometimes duplicate datasets. This fragmentation can delay decision-making and erode trust in available data. This solution enhances governance and simplifies access to unstructured data assets across the organization.
Not Documenting End-to-End Data Lineage Is Risky Busines – Understanding your data’s origins is key to successful data governance. Not everyone understands what end-to-end data lineage is or why it is important. Data Lineage Tells an Important Origin Story. Who are the data owners?
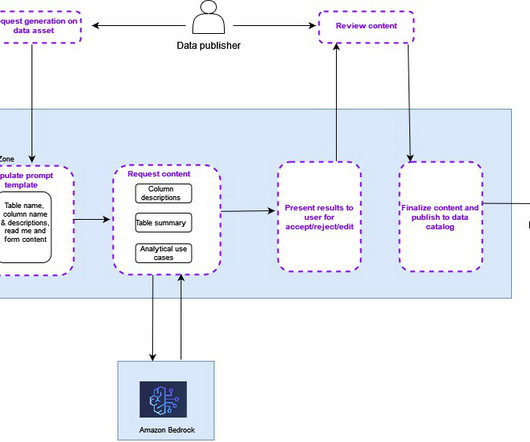
In March 2024, we announced the general availability of the generative artificial intelligence (AI) generated data descriptions in Amazon DataZone. In this post, we share what we heard from our customers that led us to add the AI-generated data descriptions and discuss specific customer use cases addressed by this capability.
The Semantic Web, both as a research field and a technology stack, is seeing mainstream industry interest, especially with the knowledge graph concept emerging as a pillar for data well and efficiently managed. And what are the commercial implications of semantic technologies for enterprise data? Source: tag.ontotext.com.
Manufacturers have long held a data-driven vision for the future of their industry. It’s one where near real-time data flows seamlessly between IT and operational technology (OT) systems. Legacy data management is holding back manufacturing transformation Until now, however, this vision has remained out of reach.
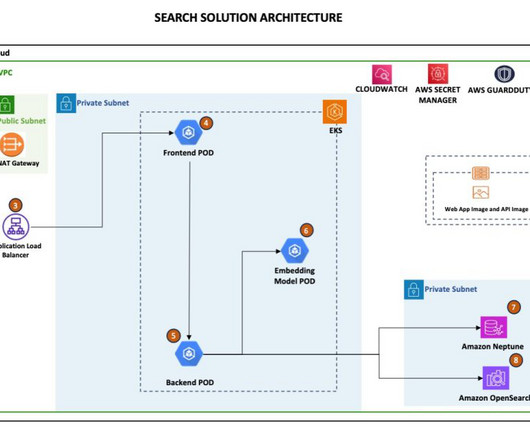
We use leading-edge analytics, data, and science to help clients make intelligent decisions. AWS services such as Amazon Neptune and Amazon OpenSearch Service form part of their data and analytics pipelines, and AWS Batch is used for long-running data and machine learning (ML) processing tasks.
California Consumer Privacy Act (CCPA) compliance shares many of the same requirements in the European Unions’ General Data Protection Regulation (GDPR). Data governance , thankfully, provides a framework for compliance with either or both – in addition to other regulatory mandates your organization may be subject to.
Data quality is crucial in data pipelines because it directly impacts the validity of the business insights derived from the data. Today, many organizations use AWS Glue Data Quality to define and enforce data quality rules on their data at rest and in transit.
We live in a hybrid data world. In the past decade, the amount of structureddata created, captured, copied, and consumed globally has grown from less than 1 ZB in 2011 to nearly 14 ZB in 2020. Impressive, but dwarfed by the amount of unstructured data, cloud data, and machine data – another 50 ZB.
Next, I will explain how knowledge graphs help them to get a unified view to data derived from multiple sources and get richer insights in less time. This requires new tools and new systems, which results in diverse and siloed data. And each of these gains requires data integration across business lines and divisions.
Amazon Redshift enables you to efficiently query and retrieve structured and semi-structureddata from open format files in Amazon S3 data lake without having to load the data into Amazon Redshift tables. Amazon Redshift extends SQL capabilities to your data lake, enabling you to run analytical queries.
Data lakes are centralized repositories that can store all structured and unstructured data at any desired scale. The power of the data lake lies in the fact that it often is a cost-effective way to store data. The power of the data lake lies in the fact that it often is a cost-effective way to store data.
What Makes a Data Fabric? Data Fabric’ has reached where ‘Cloud Computing’ and ‘Grid Computing’ once trod. Data Fabric hit the Gartner top ten in 2019. This multiplicity of data leads to the growth silos, which in turns increases the cost of integration. It is a buzzword.
This is a guest post co-written by Alex Naumov, Principal Data Architect at smava. smava believes in and takes advantage of data-driven decisions in order to become the market leader. smava believes in and takes advantage of data-driven decisions in order to become the market leader.
We live in a hybrid data world. In the past decade, the amount of structureddata created, captured, copied, and consumed globally has grown from less than 1 ZB in 2011 to nearly 14 ZB in 2020. Impressive, but dwarfed by the amount of unstructured data, cloud data, and machine data – another 50 ZB.
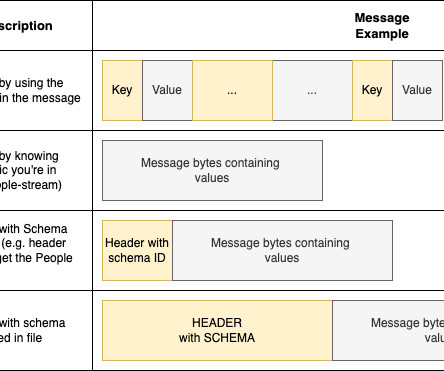
Organizations are grappling with the ever-expanding spectrum of data formats in today’s data-driven landscape. From Avro’s binary serialization to the efficient and compact structure of Protobuf, the landscape of data formats has expanded far beyond the traditional realms of CSV and JSON.
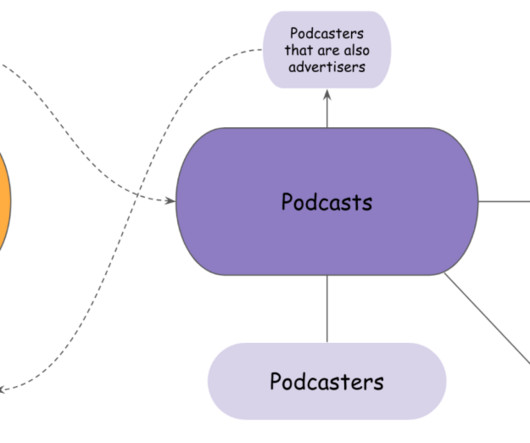
The company uses AWS Cloud services to build data-driven products and scale engineering best practices. To ensure a sustainable data platform amid growth and profitability phases, their tech teams adopted a decentralized data mesh architecture. The solution Acast implemented is a data mesh, architected on AWS.
In fact, according to the Identity Theft Resource Center (ITRC) Annual Data Breach Report , there were 2,365 cyber attacks in 2023 with more than 300 million victims, and a 72% increase in data breaches since 2021. However, there is a fundamental challenge standing in the way of being successful: data.
Ever since Hippocrates founded his school of medicine in ancient Greece some 2,500 years ago, writes Hannah Fry in her book Hello World: Being Human in the Age of Algorithms , what has been fundamental to healthcare (as she calls it “the fight to keep us healthy”) was observation, experimentation and the analysis of data.
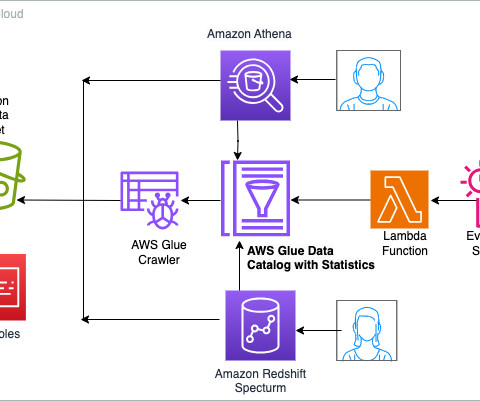
Today, we’re making available a new capability of AWS Glue Data Catalog that allows generating column-level statistics for AWS Glue tables. Data lakes are designed for storing vast amounts of raw, unstructured, or semi-structureddata at a low cost, and organizations share those datasets across multiple departments and teams.
Data platform architecture has an interesting history. A read-optimized platform that can integrate data from multiple applications emerged. In another decade, the internet and mobile started the generate data of unforeseen volume, variety and velocity. It required a different data platform solution. It is too expensive.
This view is used to identify patterns and trends in customer behavior, which can inform data-driven decisions to improve business outcomes. In this post, we discuss how you can use purpose-built AWS services to create an end-to-end data strategy for C360 to unify and govern customer data that address these challenges.
If the point of Business Intelligence (BI) data governance is to leverage your datasets to support information transparency and decision-making, then it’s fair to say that the data catalog is key for your BI strategy. At least, as far as data analysis is concerned. The Benefits of StructuredData Catalogs.
How dbt Core aids data teams test, validate, and monitor complex data transformations and conversions Photo by NASA on Unsplash Introduction dbt Core, an open-source framework for developing, testing, and documenting SQL-based data transformations, has become a must-have tool for modern data teams as the complexity of data pipelines grows.
Although less complex than the “4 Vs” of big data (velocity, veracity, volume, and variety), orienting to the variety and volume of a challenging puzzle is similar to what CIOs face with information management. Operationalizing data to drive revenue CIOs report that their roles are rising in importance and impact. What’s changed?
This is part of Ontotext’s AI-in-Action initiative aimed at enabling data scientists and engineers to benefit from the AI capabilities of our products. RED’s focus on news content serves a pivotal function: identifying, extracting, and structuringdata on events, parties involved, and subsequent impacts.
In today’s fast changing environment, enterprises that have transitioned from being focused on applications to becoming data-driven gain a significant competitive edge. There are four groups of data that are naturally siloed: Structureddata (e.g., internal metadata, industry ontologies, etc.)
Today I am talking to Christopher Bannocks , who is Group Chief Data Officer at ING. As stressed in other recent In-depth interviews [1] , data is a critical asset in banking and related activities, so Christopher’s role is a pivotal one. 2] I was asked to help solve the data problem.
FMs are multimodal; they work with different data types such as text, video, audio, and images. Large language models (LLMs) are a type of FM and are pre-trained on vast amounts of text data and typically have application uses such as text generation, intelligent chatbots, or summarization.
Knowledge Representation In the context of the Financial Services Industry domain, the most popular examples of such data are entity (Who?) These two key data elements are used in approximately 80% of the use cases in the sector. Integrating reporting to move to a more streamlined, efficient approach to data collection.
Another problem in drug development is that although companies gather a lot of data from multiple databases, they struggle to derive key insights about safety, drugability, etc. They need some kind of compass to find their way in the data jungle and identify information that is useful and relevant to their specific use case.
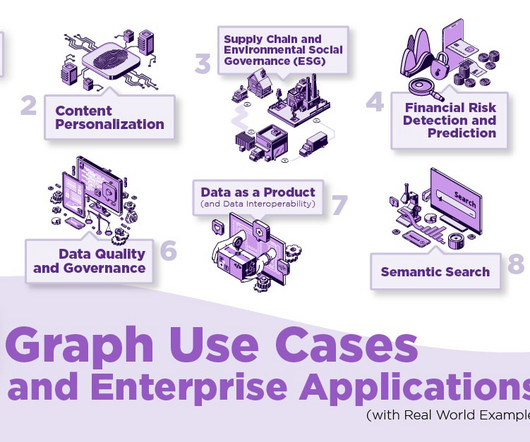
Gartner predicts that graph technologies will be used in 80% of data and analytics innovations by 2025, up from 10% in 2021. Use Case #1: Customer 360 / Enterprise 360 Customer data is typically spread across multiple applications, departments, and regions. Several factors are driving the adoption of knowledge graphs. million users.
SumUp is a leading global financial technology company driven by the purpose of leveling the playing field for small businesses. Unless, of course, the rest of their data also resides in the Google Cloud. AWS Glue gave us a cost-efficient option to migrate the data and we further optimized storage cost by pruning cold data.
Data Swamp vs Data Lake. And so will your data. You know the story well: you have a ton of data and need fast access to the right data. Building an efficient solution for data storage and processing is becoming more than just a back-office or IT challenge. Benefits of a Data Lake.
Today’s data tool challenges. By enabling their event analysts to monitor and analyze events in real time, as well as directly in their data visualization tool, and also rate and give feedback to the system interactively, they increased their data to insight productivity by a factor of 10. .
We organize all of the trending information in your field so you don't have to. Join 42,000+ users and stay up to date on the latest articles your peers are reading.
You know about us, now we want to get to know you!
Let's personalize your content
Let's get even more personalized
We recognize your account from another site in our network, please click 'Send Email' below to continue with verifying your account and setting a password.


Let's personalize your content