This site uses cookies to improve your experience. To help us insure we adhere to various privacy regulations, please select your country/region of residence. If you do not select a country, we will assume you are from the United States. Select your Cookie Settings or view our Privacy Policy and Terms of Use.
Cookie Settings
Cookies and similar technologies are used on this website for proper function of the website, for tracking performance analytics and for marketing purposes. We and some of our third-party providers may use cookie data for various purposes. Please review the cookie settings below and choose your preference.
Used for the proper function of the website
Used for monitoring website traffic and interactions
Cookie Settings
Cookies and similar technologies are used on this website for proper function of the website, for tracking performance analytics and for marketing purposes. We and some of our third-party providers may use cookie data for various purposes. Please review the cookie settings below and choose your preference.
Strictly Necessary: Used for the proper function of the website
Performance/Analytics: Used for monitoring website traffic and interactions
1) What Is Data Quality Management? 4) Data Quality Best Practices. 5) How Do You Measure Data Quality? 6) Data Quality Metrics Examples. 7) Data Quality Control: Use Case. 8) The Consequences Of Bad Data Quality. 9) 3 Sources Of Low-Quality Data. 10) Data Quality Solutions: Key Attributes.
In our cutthroat digital economy, massive amounts of data are gathered, stored, analyzed, and optimized to deliver the best possible experience to customers and partners. At the same time, inventory metrics are needed to help managers and professionals in reaching established goals, optimizing processes, and increasing business value.
In a hyper-connected digital world driven by data, there has never been a better time for businesses to gather meaningful insights on their target prospects, in addition to measuring ongoing levels of commercial growth and performance. It’s clear that social media metrics are particularly valuable to the modern brand and business.
Using data in today’s businesses is crucial to evaluate success and gather insights needed for a sustainable company. By establishing clear operational metrics and evaluate performance, companies have the advantage of using what is crucial to stay competitive in the market, and that’s data.
That’s why it’s critical to monitor and optimize relevant supply chain metrics. Finally, we will show how to combine those metrics with the help of modern KPI software and create professional supply chain dashboards. Your Chance: Want to visualize & track supply chain metrics with ease? Cash-to-cash Time Cycle.
CIOs have been able to ride the AI hype cycle to bolster investment in their gen AI strategies, but the AI honeymoon may soon be over, as Gartner recently placed gen AI at the peak of inflated expectations , with the trough of disillusionment not far behind. That doesnt mean investments will dry up overnight.
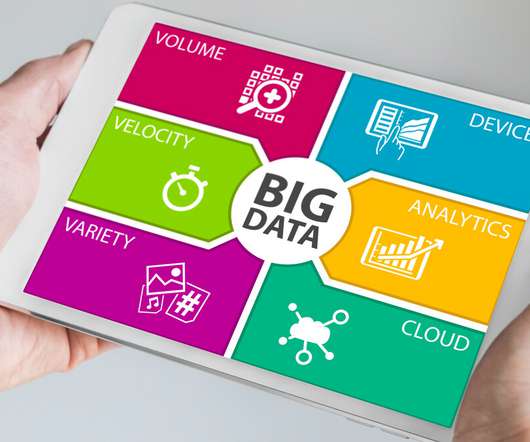
Big data has been changing the state of business for years. They are finding new ways to leverage data analytics and AI technology to maximize their ROI. E-commerce startups are investing most heavily in big data, which is why the e-commerce analytics market will be worth over $22 billion by 2025.
That’s where recruitment metrics come in. By utilizing recruiting KPIs presented through the medium of visual and interactive HR dashboards , it’s possible to use recruitment metrics to better interpret and evaluate a variety of talent acquisition factors that aid in hiring processes. And why should you care? Let’s get started.
Retailers around the world are discovering that big data can be incredibly valuable to their bottom lines. A growing number of businesses are starting to look for new data-driven approaches to streamline their business models. Targeting the Right Variables for Your Data-Driven Retail Business Model.
That said, to improve the overall efficiency, productivity, performance, and intelligence of your contact center you will need to leverage the wealth of digital data available at your fingertips. And the best way to do so is by using digital dashboards and a modern online reporting tool. We offer a 14-day free trial.
Gen AI allows organizations to unlock deeper insights and act on them with unprecedented speed by automating the collection and analysis of user data. Gen AI transforms this by helping businesses make sense of complex, high-density data, generating actionable insights that lead to impactful decisions.
Modern marketing strategies rely heavily on big data. One study found that retailers that use big data have 2.7 Big data is even more important for companies that depend on social media marketing. His statement about the importance of big data in social media marketing is even more true today.
As gen AI heads to Gartners trough of disillusionment , CIOs should consider how to realign their 2025 strategies and roadmaps. The World Economic Forum shares some risks with AI agents , including improving transparency, establishing ethical guidelines, prioritizing data governance, improving security, and increasing education.
The first step in building an AI solution is identifying the problem you want to solve, which includes defining the metrics that will demonstrate whether you’ve succeeded. It sounds simplistic to state that AI product managers should develop and ship products that improve metrics the business cares about. Agreeing on metrics.
The demand for ESG initiatives has become an integral part of a company’s strategy for long-term success, offering a promising future for those who embrace them. Aligning IT operations with ESG metrics: CIOs need to ensure that technology systems are energy-efficient and contribute to reducing the company’s carbon footprint.
In today’s data-rich environment, the challenge isn’t just collecting data but transforming it into actionable insights that drive strategic decisions. For organizations, this means adopting a data-driven approach—one that replaces gut instinct with factual evidence and predictive insights. What is BI Consulting?
IT leaders are drowning in metrics, with many finding themselves up to their KPIs in a seemingly bottomless pool of measurement tools. There are several important metrics that can be used to achieve IT success, says Jonathan Nikols, senior vice president of global enterprise sales for the Americas at Verizon. Here they are.
You need to pay close attention to analytics data on various KPIs to determine whether your strategy is working well and what tweaks need to be made. As an eCommerce entrepreneur, you have the benefit of being able to access a plethora of data at any time about multiple areas of your business and how consumers interact with it.
I recently saw an informal online survey that asked users which types of data (tabular, text, images, or “other”) are being used in their organization’s analytics applications. The results showed that (among those surveyed) approximately 90% of enterprise analytics applications are being built on tabular data.
1) What Are Product Metrics? 2) Types Of Product Metrics. 3) Product Metrics Examples You Can Use. 4) Product Metrics Framework. In an increasingly data-driven business world, the product management field isn’t exempt from this need. What Are Product Metrics? Types Of Product Metrics.
Today, many CIOs feel the same way about metrics. Metrics are only as good as their source. Too often, technology companies pay consulting or analyst firms to create metrics based on the best characteristics of their offerings,” says Judith Hurwitz, CEO of Hurwitz Strategies, an emerging technology consulting firm.
We hear a lot of hype that says organizations should be “ Data – first ”, or “AI- first , or “ Data – driven ”, or “ Technology – driven ”. Analytics are the products, the outcomes, and the ROI of our Big Data , Data Science, AI, and Machine Learning investments! Stay for the science!”
Exclusive Bonus Content: Download Data Implementation Tips! It helps managers and employees to keep track of the company’s KPIs and utilizes business intelligence to help companies make data-driven decisions. Organizations can also further utilize the data to define metrics and set goals.
Big data has been incredibly important in the marketing profession. Marketers need to rely heavily on big data technology to reach customers more effectively. Big data technology isn’t just important for making better insights. Visual marketing dashboards are prime examples of using big data effectively in marketing.
We have talked about a number of the ways that business leaders are investing in big data technology and analytics. There are many reasons that the demand for big data in the human resources sector is growing so quickly HR professionals are using big data to make strategic decisions. Big data analytics can help firms save money.
The rise of innovative, interactive, data-driven dashboard tools has made creating effective dashboards – like the one featured above – swift, simple, and accessible to today’s forward-thinking businesses. Dashboard design should be the cherry on top of your business intelligence (BI) project. Now, it’s time for the fun part.
In recent years, analytical reporting has evolved into one of the world’s most important business intelligence components, compelling companies to adapt their strategies based on powerful data-driven insights. No more sifting through droves of spreadsheets, no more patchwork data analysis, and reporting methods.
Let’s face it: every serious business that wants to generate leads and revenue needs to have a marketing strategy that will help them in their quest for profit. A marketing report is a set of data created to analyze the performance of a specific marketing campaign or effort. Structure your metrics. What Is A Marketing Report?
Also, implementing effective management reports will create a data-driven approach to making business decisions and obtaining sustainable business success. Centralized data. Armed with this knowledge, you can gain a significant edge on the competition. Download right here our free guide and get started with dashboards!
This means that the AI products you build align with your existing business plans and strategies (or that your products are driving change in those plans and strategies), that they are delivering value to the business, and that they are delivered on time. Why AI software development is different. Machine learning adds uncertainty.
Business reporting has been around for a long time but the tools and techniques of business intelligence have refined over time and now with the recent popularity of datadriven business approach, data has been identified as the most valuable asset of a business and data analytics and reporting has finally found a key place in the business world.
We have endlessly discussed the benefits of using big data to make the most out of your marketing strategies. Companies that neglect to use data analytics, AI and other forms of big data technology risk falling behind to their competitors. Data Technology Makes Email Marketing Automation Far More Feasible.
Marketing Analytics is the process of analyzing marketing data to determine the effectiveness of different marketing activities. The process of Marketing Analytics consists of data collection, data analysis, and action plan development. Types of Data Used in Marketing Analytics. Types of Data Used in Marketing Analytics.
Watch highlights from expert talks covering AI, machine learning, data analytics, and more. People from across the data world are coming together in San Francisco for the Strata Data Conference. The journey to the data-driven enterprise from the edge to AI. Data warehousing is not a use case.
Here we’re going to look at the concept of YoY and consider how you can use this essential metric to your business-boosting advantage. YoY growth can be measured for revenue, leads, conversions, or any metric that an organization is looking to improve over time. Try our professional data analysis software for a 14-day free trial today!
A CRM dashboard is a centralized hub of information that presents customer relationship management data in a way that is dynamic, interactive, and offers access to a wealth of insights that can improve your consumer-facing strategies and communications. Let’s look at this in more detail. What Is A CRM Report? Sales Activity.
Agency analytics is the process of taking data and transforming it into valuable insights that are then displayed with a professional agency dashboard. Agencies benefit from interactive dashboard tools to prove the success of their strategies and campaigns to clients. Benefits Of A Modern Agency Report.
How to measure your data analytics team? So it’s Monday, and you lead a data analytics team of perhaps 30 people. And she is numbers driven – great! But wait, she asks you for your team metrics. Like most leaders of data analytic teams, you have been doing very little to quantify your team’s success.
In at least one way, it was not different, and that was in the continued development of innovations that are inspired by data. This steady march of data-driven innovation has been a consistent characteristic of each year for at least the past decade.
In your daily business, many different aspects and ‘activities’ are constantly changing – sales trends and volume, marketing performance metrics, warehouse operational shifts, or inventory management changes. Let’s get started. Your Chance: Want to test professional business reporting software? Explore our 14-day free trial.
To be a platform business, you need a network, demand, supply, data, and a customer experience that differentiates. We divided the technical challenges into a few areas, none of which focused on an ERP rationalization strategy. These high-level metrics tie to every leaders objectives. How did you manage that shift in incentives?
Enterprises that need to share and access large amounts of data across multiple domains and services need to build a cloud infrastructure that scales as need changes. To achieve this, the different technical products within the company regularly need to move data across domains and services efficiently and reliably.
We’ll also discuss building DataOps expertise around the data organization, in a decentralized fashion, using DataOps centers of excellence (COE) or DataOps Dojos. Centralizing analytics helps the organization standardize enterprise-wide measurements and metrics. Test data management and other functions provided ‘as a service’ .
As a CEO, you’re responsible for overseeing every aspect of your business, from the people and the internal culture all the way through to key sales, marketing, and financial strategies. And to gain greater vision, you need to embrace the power of digital data. Wider accessibility to important data. The right KPIs & metrics.
We organize all of the trending information in your field so you don't have to. Join 42,000+ users and stay up to date on the latest articles your peers are reading.
You know about us, now we want to get to know you!
Let's personalize your content
Let's get even more personalized
We recognize your account from another site in our network, please click 'Send Email' below to continue with verifying your account and setting a password.


Let's personalize your content