This site uses cookies to improve your experience. To help us insure we adhere to various privacy regulations, please select your country/region of residence. If you do not select a country, we will assume you are from the United States. Select your Cookie Settings or view our Privacy Policy and Terms of Use.
Cookie Settings
Cookies and similar technologies are used on this website for proper function of the website, for tracking performance analytics and for marketing purposes. We and some of our third-party providers may use cookie data for various purposes. Please review the cookie settings below and choose your preference.
Used for the proper function of the website
Used for monitoring website traffic and interactions
Cookie Settings
Cookies and similar technologies are used on this website for proper function of the website, for tracking performance analytics and for marketing purposes. We and some of our third-party providers may use cookie data for various purposes. Please review the cookie settings below and choose your preference.
Strictly Necessary: Used for the proper function of the website
Performance/Analytics: Used for monitoring website traffic and interactions
In our information-rich age, a business can accelerate its success by harnessing its organizational data in a way that is both efficient and value-driven. To squeeze every last drop of value from your data, both in an operational and strategic sense, it’s important to leverage the right online reporting tool.
Dashboards often are the best way to gain insight into an organization and its various departments, operations and performance. Well-built, focused dashboards easily serve up summaries and reports of the BI that’s most critical to the organization. Exclusive Bonus Content: Download Data Implementation Tips!
Operationalreports have the potential to greatly enhance business performance through the utilization of data-driven insights. These reports offer a structured and comprehensible representation of data, enabling a clearer understanding of complex issues that might otherwise remain elusive.
Enterprises that need to share and access large amounts of data across multiple domains and services need to build a cloud infrastructure that scales as need changes. To achieve this, the different technical products within the company regularly need to move data across domains and services efficiently and reliably.
—April 11, 2022— insightsoftware , a global provider of reporting, analytics, and performance management solutions that drive greater financial intelligence, today expanded the Angles product line , with the launch of new solutions for no-code operationalreporting for NetSuite and Deltek. Angles streamlines the process.
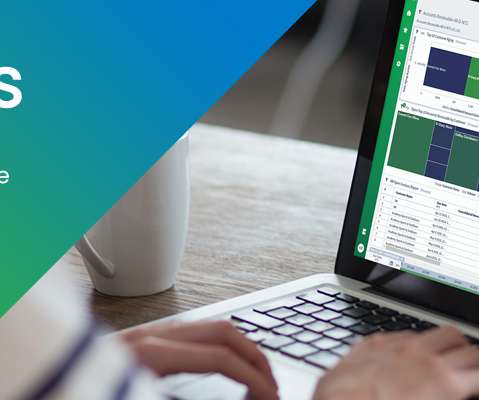
Recognizing a need for better operational analytics, insightsoftware leveraged award-winning technology from Logi Analytics to provide Oracle ERP Cloud users the ability to customize, create, and share interactive dashboards and reports across all departments of a business.
3) Weekly Report Templates & Examples. 4) Top Elements Of A Weekly Performance Report. Businesses have been analyzing their performance for decades through traditional written reports, but with the amount of data being produced every day, the need for more frequent reporting is growing.
This is a guest post co-written by Alex Naumov, Principal Data Architect at smava. smava believes in and takes advantage of data-driven decisions in order to become the market leader. smava believes in and takes advantage of data-driven decisions in order to become the market leader.
By George Trujillo, Principal Data Strategist, DataStax Increased operational efficiencies at airports. To succeed with real-time AI, data ecosystems need to excel at handling fast-moving streams of events, operationaldata, and machine learning models to leverage insights and automate decision-making.
Modak, a leading provider of modern data engineering solutions, is now a certified solution partner with Cloudera. Customers can now seamlessly automate migration to Cloudera’s Hybrid Data Platform — Cloudera Data Platform (CDP) to dynamically auto-scale cloud services with Cloudera Data Engineering (CDE) integration with Modak Nabu.
It’s ironic that many of those same businesses fail to devote the necessary time and energy to optimizing working capital. A good ERP system can go a long way toward optimizing inventory management with accurate demand forecasting, effective control over quantities and locations, and improved processes for managing inventory.
In today’s data-driven world, seamless integration and transformation of data across diverse sources into actionable insights is paramount. With AWS Glue, you can discover and connect to hundreds of diverse data sources and manage your data in a centralized data catalog.
Though that may seem odd at first, it is because companies treat their financial data differently. They may be willing to experiment with the cloud in other parts of their business, but they feel that they can’t put the quality, consistency, security, or availability of financial data in jeopardy. Thus, it remains on-premises.
Designed for software teams, Logi Composer delivers the first out-of-the-box development experience for embedded analytics, enabling rapid design, build, and embed interactive dashboards and data visualizations. The volume of data in organizations is growing exponentially. The volume of data in organizations is growing exponentially.
The survey examined perceptions about the impact of cloud-based ERPs on the financial reporting process, and assessed the readiness of respondents’ organizations to adopt cloud ERPs. insightsoftware’s financial reporting solutions are easy to install, use, analyze, and trust. 25% are not currently planning to move to a cloud ERP.
Acquiring and Preparing Data for Power View and Excel. Data Modelling Patterns 101 using Power Pivot. Tips and Tricks on Charts and Data Models. Publishing and Administering Dashboards and Reports in Power BI for the Organisation. Publishing and Administering Dashboards and Reports in Power BI for the Organisation.
Acquiring and Preparing Data for Power View and Excel. Data Modelling Patterns 101 using Power Pivot. Tips and Tricks on Charts and Data Models. Publishing and Administering Dashboards and Reports in Power BI for the Organisation. Publishing and Administering Dashboards and Reports in Power BI for the Organisation.
Understanding your SAP data to its fullest is the first step o n the journey towards a more sustainable future. W ith a n advanced operationalreporting solution that delivers proper data analysis , you can put your best foot forward. Total dependence on fossil fuels.
Modern data infrastructure demands tools that scale effortlessly to handle growing volumes and complexity. Its distributed architecture empowers organizations to query massive datasets across databases, data lakes, and cloud platforms with speed and reliability. Resource groups also play a vital role in optimizing query performance.
Todays decision-makers and data-driven applications demand more than static dashboards and generic insightsthey need a system that evolves with their business and delivers contextually precise, actionable analytics. In the BI world, where data must be precise, this is unacceptable. How Does It Work? Thats where Simba comes in.
Although Oracle E-Business Suite (EBS) provides a centralized hub for financial data, the manual process of exporting data into spreadsheets is both time-consuming and prone to errors, forcing finance teams to spend considerable time verifying numbers. How do you ensure greater efficiency and accuracy for your financial reports?
However, the path to cloud adoption is often fraught with concerns about operational disruptions, downtime, and the complexities of maintaining seamless business operations. According to recent FSN research , just one day of data downtime can equate to a six-figure cost for your organization.
If you’re relying on JasperReports or Crystal Reports to power your datareporting and insights, you’ve likely heard the news: many popular versions are reaching end-of-life, and it’s time to start planning your next steps. Skills shortages only exacerbate this problem.
However, due to factors like insufficient use cases, lack of necessary technical skills, low-quality data, and a general reluctance to embrace new technology, the finance industry has been slow to adopt AI. Investing in user-friendly tools with outstanding data integration options will help make the transition seamless.
Thanks to Data? Enter the torpedo barrela radical, data-driven redesign. The torpedo bat shifts mass toward where each hitter actually makes contactessentially creating custom bats optimized for individual swing mechanics. While other teams stuck with tradition, the Yankees let the data leadand redesigned the game.
A recent KPMG report shows that 60% of leaders are gearing up to invest in cutting-edge digital technology to fortify their supply chain processes, elevate data synthesis, and amplify analysis capabilities. Many operationalreporting teams remain buried under static PDF reports or rigid native ERP functionalities.
By leveraging data analysis to solve high-value business problems, they will become more efficient. This is in contrast to traditional BI, which extracts insight from data outside of the app. that gathers data from many sources. These tools prep that data for analysis and then provide reporting on it from a central viewpoint.
Info-Tech has released its 2025 Data Quadrant Report , which recognizes the best in technology solutions. Evaluating feedback from 3,433 users, this years report turned its focus toward business intelligence (BI) and analytics solutions that drive better decision-making for customers.
In a survey of 375 Oracle-driven finance leaders , insightsoftware and Hanover Research found skills shortages soared to the number one factor that drives Oracle users to be more efficient, with 92% of Oracle ERP finance teams grappling with skills shortages to some degree. With Hubble, you can: Get up and running quickly.
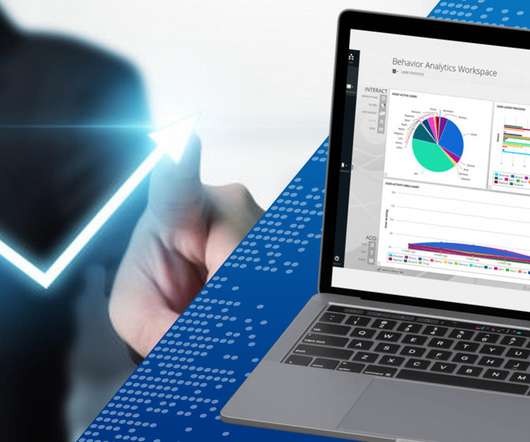
Analytics are the gateway to understanding, enabling users to interact with and interpret the insights generated through data collection, preparation, and analysis. Time Loss in the Wees of Ad Hoc Requests A key hidden cost of suboptimal analytics is the drain on development resources caused by ad hoc reporting requests.
A data pipeline is a series of processes that move raw data from one or more sources to one or more destinations, often transforming and processing the data along the way. Data pipelines support data science and business intelligence projects by providing data engineers with high-quality, consistent, and easily accessible data.
When extracting your financial and operationalreportingdata from a cloud ERP, your enterprise organization needs accurate, cost-efficient, user-friendly insights into that data. While real-time extraction is historically faster, your team needs the reliability of the replication process for your cloud data extraction.
From workflow automation to process optimization, AI has already revolutionized the way people work today – and we’ve only just begun to scratch the surface of its potential. Demand Forecasting: Machine learning analyzes sales data to predict future demand, leading to better inventory management and resource allocation.
Oracle-driven finance teams today face increasingly complex challenges. Offering robust functionalities, your Oracle ERP can help overcome common finance challenges while moving beyond manual data entry into spreadsheets. Customizing these reports adds even more time to the process.
The quick and dirty definition of data mapping is the process of connecting different types of data from various data sources. Data mapping is a crucial step in data modeling and can help organizations achieve their business goals by enabling data integration, migration, transformation, and quality.
That means embracing technology for streamlined processes, accurate data, and better collaboration. That’s where Jet Reports from insightsoftware comes in. This means you get real-time, accurate data without the headaches. Relying on outdated data is like driving a car blindfolded.
This untapped potential suggests a significant opportunity for those willing to embrace AI and gain a competitive edge through intelligent automation and data-driven financial insights. However, to truly unlock this potential, complete data preparation and control are essential.
For many organizations, Qlik is the trusted platform that powers their data-driven decision-making. Enter Vizlib by insightsoftware —a game-changing solution that transforms how you interact with and present your Qlik data. That’s where Vizlib stands out.
In the dynamic field of Business Intelligence (BI) , stability and consistency are paramount for accurate and reliable data analysis. Imagine trying to analyze data with a constantly changing backend—it’s like kicking the legs out from underneath a table and still expecting it to stay upright.
In today’s fast-paced business environment, having control over your data can be the difference between success and stagnation. Leaning on Master Data Management (MDM), the creation of a single, reliable source of master data, ensures the uniformity, accuracy, stewardship, and accountability of shared data assets.
These processes, ranging from data entry to report generation, consume valuable time and resources, hindering productivity and accuracy. Unify Fragmented SAP Data Your SAP ERP equips you with a unified view of your financial data. How do you unify data silos for a better picture of your organizational health?
Much like an outdated oven can still be used to cook a meal, outdated planning processes like manual data entry, static spreadsheets, and inflexible budgeting models can still get your budget done, but it won’t be nearly as efficient as using technology designed for today’s data environment.
At insightsoftware, we deliver advanced analytics with Logi Symphony , which offers powerful self-service and managed dashboards, AI-driven assistance, and broader accessibility to users at every level. These enhancements transform how users access and gain insights from their data.
Analytics is vital now because providing end-users with the ability to analyze, slice, and dice data within the context of their application is essential to staying competitive in today’s fast-paced digital world. Both product analytics and embedded analytics fall into this tool category.
We organize all of the trending information in your field so you don't have to. Join 42,000+ users and stay up to date on the latest articles your peers are reading.
You know about us, now we want to get to know you!
Let's personalize your content
Let's get even more personalized
We recognize your account from another site in our network, please click 'Send Email' below to continue with verifying your account and setting a password.


Let's personalize your content