This site uses cookies to improve your experience. To help us insure we adhere to various privacy regulations, please select your country/region of residence. If you do not select a country, we will assume you are from the United States. Select your Cookie Settings or view our Privacy Policy and Terms of Use.
Cookie Settings
Cookies and similar technologies are used on this website for proper function of the website, for tracking performance analytics and for marketing purposes. We and some of our third-party providers may use cookie data for various purposes. Please review the cookie settings below and choose your preference.
Used for the proper function of the website
Used for monitoring website traffic and interactions
Cookie Settings
Cookies and similar technologies are used on this website for proper function of the website, for tracking performance analytics and for marketing purposes. We and some of our third-party providers may use cookie data for various purposes. Please review the cookie settings below and choose your preference.
Strictly Necessary: Used for the proper function of the website
Performance/Analytics: Used for monitoring website traffic and interactions
Today’s digital data has given the power to an average Internet user a massive amount of information that helps him or her to choose between brands, products or offers, making the market a highly competitive arena for the best ones to survive. First things first – organizing and prioritizing your marketing data.
Visualizing the data and interacting on a single screen is no longer a luxury but a business necessity. A professional dashboard maker enables you to access data on a single screen, easily share results, save time, and increase productivity. That’s why we welcome you to the world of interactive dashboards.
Nowadays, sales is both science and art. Best practice blends the application of advanced data models with the experience, intuition and knowledge of sales management, to deeply understand the sales pipeline. Why sales and analysts should work together. Why sales and analysts should work together.
Ask any business leader worth their salt if their business is data-driven and they’ll say “Of course we are.” But how data-driven are they really? Despite best intentions, this is often more of an aspiration than a reality, and they’re not as data-driven as they think. Not just data teams.
Sisense News is your home for corporate announcements, new Sisense features, product innovation, and everything we roll out to empower our users to get the most out of their data. Every company is becoming a data company; there’s no getting around it. Smarter insights with AI-powered data explanations. Now you don’t have to!
Data-informed decision-making is a key attribute of the modern digital business. But experienced data analysts and data scientists can be expensive and difficult to find and retain. Self-service analytics typically involves tools that are easy to use and have basic data analytics capabilities.
“BI is about providing the right data at the right time to the right people so that they can take the right decisions” – Nic Smith. Data analytics isn’t just for the Big Guys anymore; it’s accessible to ventures, organizations, and businesses of all shapes, sizes, and sectors. And the success stories are seemingly endless.
Business intelligence for marketing is the application of business intelligence in the field of marketing, allowing marketers to collect data, debugging data and processing it out through enterprise resource planning and company strategy. Customer-based sales strategy. Marketing data visualization display(by FineReport).
A critical part of effectively exploring your data, transforming it into actionable insights, and enhancing decision-making for your business is being empowered to slice and dice your data, and be less dependent on technical resources for new updates. This, in turn, affects the quality of the insights that you can unlock.
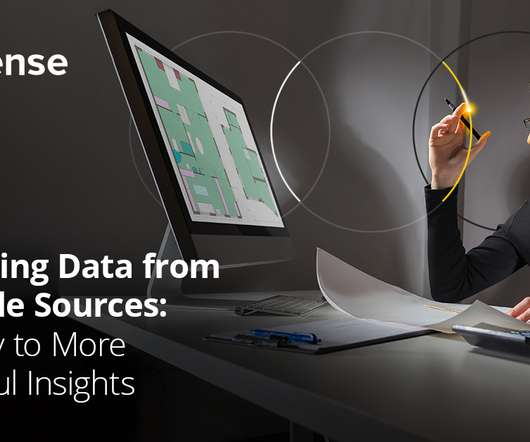
To get truly powerful insights, you need to pull in data from multiple sources. Additional data sources increase your chances to inform actions, fueling top-line and bottom-line growth. Measuremen: Optimizing facilities use with data from numerous sources. Since those early days, Measuremen has broadened its data sources.
We live in a world of data: there’s more of it than ever before, in a ceaselessly expanding array of forms and locations. Dealing with Data is your window into the ways organizations tackle the challenges of this new world to help their companies and their customers thrive. Understanding how data becomes insights.
One of the main goals of a digital transformation is to empower everyone within an organization to make smarter, data-driven decisions. Before we dig into what your enterprise data integration will do for your organization, let’s touch briefly on the challenges that collecting all of an enterprise’s data can entail.
Power BI is Microsoft’s interactive data visualization and analytics tool for business intelligence (BI). With Power BI, you can pull data from almost any data source and create dashboards that track the metrics you care about the most. Power BI’s rich reports or dashboards can be embedded into reporting portals you already use.
In our world of digital analytics often these things are called dashboards… I had to shrink the size to make it fit the available screen, but even if you saw it at full glorious resolution, I'm sure you'll very quickly come to the conclusion that this is just a data puke. Yes, it does summarize data from many reports into one.
Specialty’s Café and Bakery is a great example of a retailer that is using data to drive decisions related to product development and selection, inventories, staffing, and more to attract and keep customers. This offers more accurate product demand predictions, all while reducing the dependency on highly skilled data scientists.
With our three products, Trakstar Hire , Trakstar Perform , and Trakstar Learn , HR leaders can use data to take an integrated approach and foster a better employee experience. This enabled our customers to see their data in a way they had never seen before. In January 2022, we launched the Perform Insights dashboards.
Amazon Redshift is a fast, petabyte-scale cloud data warehouse that makes it simple and cost-effective to analyze all of your data using standard SQL. Tens of thousands of customers today rely on Amazon Redshift to analyze exabytes of data and run complex analytical queries, making it the most widely used cloud data warehouse.
Lindt has used Cognos Analytics for more than 20 years as an analytics solution for its sales and marketing functions. Left to their own devices, they had resorted to using legacy reporting tools such as Excel that required manual gathering, slicing and dicing of data.
However, NetSuite’s native reporting tools, while helpful for basic tasks, can create serious roadblocks to data trust within your organization. Additionally, disconnected data forces manual verification, raising doubts about accuracy and eroding trust. Forget data-chasing and siloed spreadsheets.
Top line revenue refers to the total value of sales of an organization’s services or products. High-level challenge: The need for real-time analytics Previous efforts at Poshmark for improving CX through analytics were based on batch processing of analytics data and using it on a daily basis to improve CX.
By leveraging data analysis to solve high-value business problems, they will become more efficient. This is in contrast to traditional BI, which extracts insight from data outside of the app. that gathers data from many sources. These tools prep that data for analysis and then provide reporting on it from a central viewpoint.
Analytics is vital now because providing end-users with the ability to analyze, slice, and dicedata within the context of their application is essential to staying competitive in today’s fast-paced digital world. Imagine your client is using a CRM tool to manage their sales pipeline.
The capacity to facilitate exploration differentiates business intelligence, allowing users to quickly and easily slice and dice their data in various ways to produce meaningful insights that direct leaders toward better business decisions. Phase 2: Gathering and Organizing Data.
Without deep technical knowledge of Epicor’s data structures, attempting to manually create custom reports can create serious roadblocks to data trust within your organization. Additionally, disconnected data forces manual verification, raising doubts about accuracy and eroding trust.
We organize all of the trending information in your field so you don't have to. Join 42,000+ users and stay up to date on the latest articles your peers are reading.
You know about us, now we want to get to know you!
Let's personalize your content
Let's get even more personalized
We recognize your account from another site in our network, please click 'Send Email' below to continue with verifying your account and setting a password.


Let's personalize your content