This site uses cookies to improve your experience. To help us insure we adhere to various privacy regulations, please select your country/region of residence. If you do not select a country, we will assume you are from the United States. Select your Cookie Settings or view our Privacy Policy and Terms of Use.
Cookie Settings
Cookies and similar technologies are used on this website for proper function of the website, for tracking performance analytics and for marketing purposes. We and some of our third-party providers may use cookie data for various purposes. Please review the cookie settings below and choose your preference.
Used for the proper function of the website
Used for monitoring website traffic and interactions
Cookie Settings
Cookies and similar technologies are used on this website for proper function of the website, for tracking performance analytics and for marketing purposes. We and some of our third-party providers may use cookie data for various purposes. Please review the cookie settings below and choose your preference.
Strictly Necessary: Used for the proper function of the website
Performance/Analytics: Used for monitoring website traffic and interactions
DataOps has become an essential methodology in pharmaceutical enterprise data organizations, especially for commercial operations. Companies that implement it well derive significant competitive advantage from their superior ability to manage and create value from data.
Using data in today’s businesses is crucial to evaluate success and gather insights needed for a sustainable company. By establishing clear operational metrics and evaluate performance, companies have the advantage of using what is crucial to stay competitive in the market, and that’s data.
Experts predict that by 2025, around 175 Zettabytes of data will be generated annually, according to research from Seagate. But with so much data available from an ever-growing range of sources, how do you make sense of this information – and how do you extract value from it? Looking for a bite-sized introduction to reporting?
Big data is playing a vital role in the evolution of small business. A compilation of research from the G2 Learning Hub Shows the number of businesses relying on big data is rising. They cited one study showing that 40% of businesses need to use unstructured data on a nearly daily basis. It makes your site more accessible.
With individuals and their devices constantly connected to the internet, user data flow is changing how companies interact with their customers. Big data has become the lifeblood of small and large businesses alike, and it is influencing every aspect of digital innovation, including web development. What is Big Data?
Visualizing the data and interacting on a single screen is no longer a luxury but a business necessity. A professional dashboard maker enables you to access data on a single screen, easily share results, save time, and increase productivity. That’s why we welcome you to the world of interactive dashboards.
Digital data, by its very nature, paints a clear, concise, and panoramic picture of a number of vital areas of business performance, offering a window of insight that often leads to creating an enhanced business intelligence strategy and, ultimately, an ongoing commercial success. billion , growing at a CAGR of 26.98% from 2016.
Digital marketers work online and leverage online tools to drive sales. But driving sales through the maximization of profit and minimization of cost is impossible without data analytics. Data analytics is the process of drawing inferences from datasets to understand the information they contain. Personalized Services.
Organizations are managing and analyzing large datasets every day, but many still need the right tools to generate data-driven insights. Even more, organizations need the ability to bring data insights to the right users to make faster, more effective business decisions amid unpredictable market changes.
3) The Role Of Data Drilling In Reporting. It is no secret that the business world is becoming more data-driven by the minute. Every day, more and more decision-makers rely on data coming from multiple sources to make informed strategic decisions. In general, data drills can be added to any chart or data visualization.
Despite the many benefits that big data offers to the e-commerce sector, many companies are struggling to use it effectively. We have talked a lot about the importance of big data in e-commerce. A growing number of ecommerce brands are using centralized data systems to help improve efficiency.
These applications are designed to meet specific business needs by integrating proprietary data and help to ensure more accurate and relevant responses. This trend signals a move toward more efficient and personalized AI-driven business solutions. This synergy enhances productivity and cost-efficiency.
Consider that e-commerce’s acceleration due to the pandemic saw retailers’ digital sales penetration realize 10 years of growth in just the first three months of 2020 alone. . In summary, predicting future supply chain demands using last year’s data, just doesn’t work. Leveraging data where it lies.
In this post, we share how Encored runs data engineering pipelines for containerized ML applications on AWS and how they use AWS Lambda to achieve performance improvement, cost reduction, and operational efficiency. It allows for efficient data storage and transmission, as well as easy manipulation of the data using specialized software.
With data growing at a staggering rate, managing and structuring it is vital to your survival. In this piece, we detail the Israeli debut of Periscope Data. Driving startup growth with the power of data. Driving startup growth with the power of data. The rise of the data team: from startup to unicorn.
California Consumer Privacy Act (CCPA) compliance shares many of the same requirements in the European Unions’ General Data Protection Regulation (GDPR). Data governance , thankfully, provides a framework for compliance with either or both – in addition to other regulatory mandates your organization may be subject to.
That is changing with the introduction of inexpensive IoT-based data loggers that can be attached to shipments. Data loggers connect to centralized data management systems and transfer their readings, enabling efficient recording, analysis and decision-making. That brings us to the value of timely data and analytics.
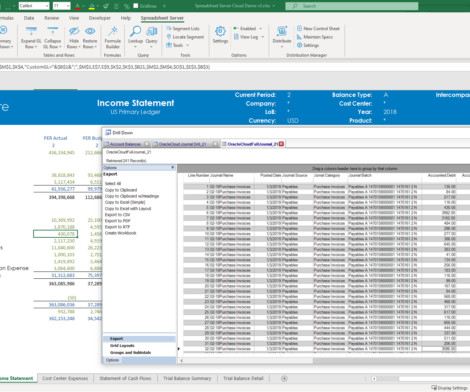
Most operational finance activities are driven by the month end and ledger close, typically involving a web of steps including transaction processing, reconciliation, journal entry capture, and financial statement preparation. Tip 3: Make decisions with operational data. Tip 1: Overcoming month-end inefficiencies.
Digging into quantitative data Why is quantitative data important What are the problems with quantitative data Exploring qualitative data Qualitative data benefits Getting the most from qualitative data Better together. Almost every modern organization is now a data-generating machine. or “how often?”
In 2013, Amazon Web Services revolutionized the data warehousing industry by launching Amazon Redshift , the first fully-managed, petabyte-scale, enterprise-grade cloud data warehouse. Amazon Redshift made it simple and cost-effective to efficiently analyze large volumes of data using existing business intelligence tools.
The foundation for ESG reporting, of course, is data. Always the gatekeepers of much of the data necessary for ESG reporting, CIOs are finding that companies are even more dependent on them,” says Nancy Mentesana, ESG executive director at Labrador US, a global communications firm focused on corporate disclosure documents.
Introduction to the World of SaaS BI Tools In today’s data-driven business landscape, SaaS BI tools have emerged as indispensable assets for companies seeking to harness the power of data. Additionally, there is a growing demand for advanced analytics and data visualization tools to make data-driven decisions.
It’s no secret that more and more organizations are turning to solutions that can provide benefits of real time data to become more personalized and customer-centric , as well as make better business decisions. Real-time data gives you the right information, almost immediately and in the right context.
Hybrid cloud enables businesses worldwide to promote data security and accessibility for various projects and analysis. A mix of institutional knowledge, legacy applications, data and analytics form the backbone of many organizations’ IT operations, however when a single component falls out of harmony, the entire system can fail.
New machine learning and data analytics tools have made it easier to understand their buying decisions and optimize your funnels, both through your offline and online marketing channels. Are all the elements organized in such a way that everything looks appealing but it drives sales and engagement at the same time?
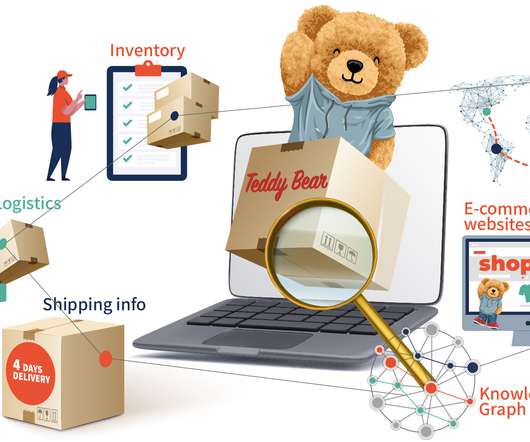
In the competitive world of e-commerce, data is not just a resource—it's a lifeline. From understanding customer behavior to optimizing supply chains, the right data can propel an online business to new heights. Let's explore how InsightOut is leading the way and revolutionizing the way e-commerce businesses leverage data.
Following an unprecedented summer of accolades that have helped establish Alation as the leader in emerging data catalog category, we are in the midst of a nine-show tour. After a blockbuster premiere at the Strata Data Conference in New York, the tour will take us to six different states and across the pond to London.
The implications of consumer behavior for retailers range from the need to ensure relevant customer service and quick delivery to serving personalized content and managing data from disparate systems. Of course, there are various platforms and data architectures for managing customer and product data. Click To Tweet.
Operational reports have the potential to greatly enhance business performance through the utilization of data-driven insights. These reports offer a structured and comprehensible representation of data, enabling a clearer understanding of complex issues that might otherwise remain elusive.
It’s a big week for us, as many Clouderans descend on New York for the Strata Data Conference. The week is typically filled with exciting announcements from Cloudera and many partners and others in the data management, machine learning and analytics industry. Congratulations and high fives to every organization that submitted entries.
It was titled, The Gartner 2021 Leadership Vision for Data & Analytics Leaders. This was for the Chief Data Officer, or head of data and analytics. The fill report is here: Leadership Vision for 2021: Data and Analytics. Which industry, sector moves fast and successful with data-driven?
Read on to learn how data literacy, information as a second language, and insight-driven analytics take digital strategy to a new level. C-level executives and professionals alike must learn to speak a new language - data. The benefit of speaking data, a.k.a. Increasing data literacy is the answer.
In Moving Parts , we explore the unique data and analytics challenges manufacturing companies face every day. The world of data in modern manufacturing. Manufacturing companies that adopted computerization years ago are already taking the next step as they transform into smart data-driven organizations.
A data pipeline is a series of processes that move raw data from one or more sources to one or more destinations, often transforming and processing the data along the way. Data pipelines support data science and business intelligence projects by providing data engineers with high-quality, consistent, and easily accessible data.
Business leaders know its crucial to use identity-driven customer data to make smart decisions. The consequences of getting identity wrong are substantial: Poor data quality = missed insights, operational inefficiencies, and wasted marketing spend. Slow digital adoption = inability to activate customer data reliably at scale.
The days of highly available capital, excessive spending on sales and marketing, and ultra-high growth rates, we view that as really being in the rearview mirror. We want to be able to understand what type of retention rates or churn or down sale rates we are seeing and how that can allow us to pivot for the balance of the year.
We organize all of the trending information in your field so you don't have to. Join 42,000+ users and stay up to date on the latest articles your peers are reading.
You know about us, now we want to get to know you!
Let's personalize your content
Let's get even more personalized
We recognize your account from another site in our network, please click 'Send Email' below to continue with verifying your account and setting a password.


Let's personalize your content