This site uses cookies to improve your experience. To help us insure we adhere to various privacy regulations, please select your country/region of residence. If you do not select a country, we will assume you are from the United States. Select your Cookie Settings or view our Privacy Policy and Terms of Use.
Cookie Settings
Cookies and similar technologies are used on this website for proper function of the website, for tracking performance analytics and for marketing purposes. We and some of our third-party providers may use cookie data for various purposes. Please review the cookie settings below and choose your preference.
Used for the proper function of the website
Used for monitoring website traffic and interactions
Cookie Settings
Cookies and similar technologies are used on this website for proper function of the website, for tracking performance analytics and for marketing purposes. We and some of our third-party providers may use cookie data for various purposes. Please review the cookie settings below and choose your preference.
Strictly Necessary: Used for the proper function of the website
Performance/Analytics: Used for monitoring website traffic and interactions
Amazon DataZone now launched authentication supports through the Amazon Athena JDBC driver, allowing data users to seamlessly query their subscribed datalake assets via popular business intelligence (BI) and analytics tools like Tableau, Power BI, Excel, SQL Workbench, DBeaver, and more.
Amazon DataZone is a data management service that makes it faster and easier for customers to catalog, discover, share, and governdata stored across AWS, on premises, and from third-party sources. When you’re connected, you can query, visualize, and share data—governed by Amazon DataZone—within Tableau.
Data landscape in EUROGATE and current challenges faced in datagovernance The EUROGATE Group is a conglomerate of container terminals and service providers, providing container handling, intermodal transports, maintenance and repair, and seaworthy packaging services. Eliminate centralized bottlenecks and complex data pipelines.
That means your cloud data assets must be available for use by the right people for the right purposes to maximize their security, quality and value. Why You Need Cloud DataGovernance. Regulatory compliance is also a major driver of datagovernance (e.g., GDPR, CCPA, HIPAA, SOX, PIC DSS).
Data is your generative AI differentiator, and a successful generative AI implementation depends on a robust data strategy incorporating a comprehensive datagovernance approach. Datagovernance is a critical building block across all these approaches, and we see two emerging areas of focus.
The combination of these three services provides a powerful, comprehensive solution for end-to-end data lineage analysis. In this post, we use dbt for data modeling on both Amazon Athena and Amazon Redshift. This led to the implementation of both Athena on dbt and Amazon Redshift on dbt architectures.
Talend data integration software offers an open and scalable architecture and can be integrated with multiple data warehouses, systems and applications to provide a unified view of all data. Its code generation architecture uses a visual interface to create Java or SQL code.
We are excited to announce the preview of API-driven, OpenLineage-compatible data lineage in Amazon DataZone to help you capture, store, and visualize lineage of data movement and transformations of data assets on Amazon DataZone. The lineage visualized includes activities inside the Amazon DataZone business data catalog.
In the era of big data, datalakes have emerged as a cornerstone for storing vast amounts of raw data in its native format. They support structured, semi-structured, and unstructured data, offering a flexible and scalable environment for data ingestion from multiple sources.
Building a datalake on Amazon Simple Storage Service (Amazon S3) provides numerous benefits for an organization. However, many use cases, like performing change data capture (CDC) from an upstream relational database to an Amazon S3-based datalake, require handling data at a record level.
At Atlanta’s Hartsfield-Jackson International Airport, an IT pilot has led to a wholesale data journey destined to transform operations at the world’s busiest airport, fueled by machine learning and generative AI. He is a very visual person, so our proof of concept collects different data sets and ingests them into our Azure data house.
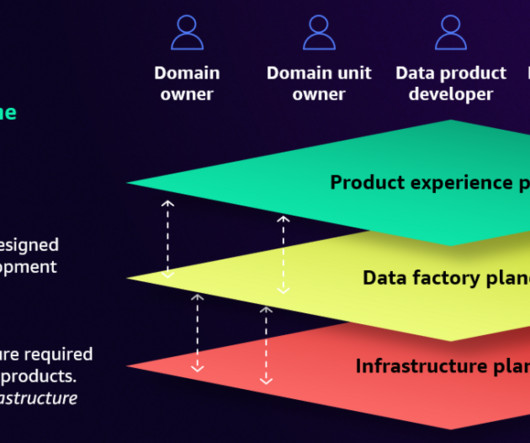
Under the federated mesh architecture, each divisional mesh functions as a node within the broader enterprise data mesh, maintaining a degree of autonomy in managing its data products. These nodes can implement analytical platforms like datalake houses, data warehouses, or data marts, all united by producing data products.
The data can also help us enrich our commodity products. How are you populating your datalake? We’ve decided to take a practical approach, led by Kyle Benning, who runs our data function. Then our analytics team, an IT group, makes sure we build the datalake in the right sequence.
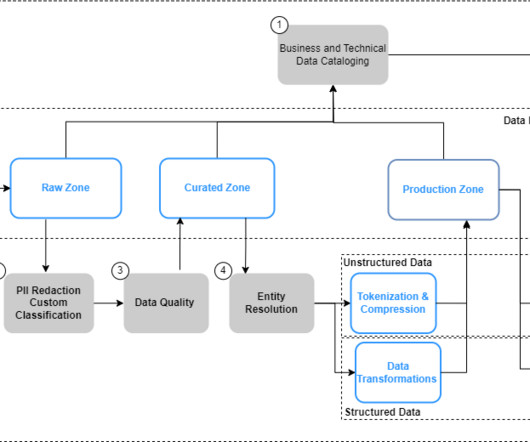
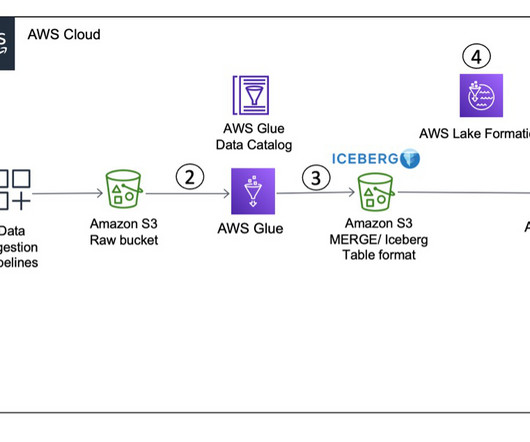
AWS Lake Formation and the AWS Glue Data Catalog form an integral part of a datagovernance solution for datalakes built on Amazon Simple Storage Service (Amazon S3) with multiple AWS analytics services integrating with them. We realized that your use cases need more flexibility in datagovernance.
Analytics remained one of the key focus areas this year, with significant updates and innovations aimed at helping businesses harness their data more efficiently and accelerate insights. From enhancing datalakes to empowering AI-driven analytics, AWS unveiled new tools and services that are set to shape the future of data and analytics.
However, enterprises often encounter challenges with data silos, insufficient access controls, poor governance, and quality issues. Embracing data as a product is the key to address these challenges and foster a data-driven culture.
Data architect role Data architects are senior visionaries who translate business requirements into technology requirements and define data standards and principles, often in support of data or digital transformations. In some ways, the data architect is an advanced data engineer.
So we have a visualization layer where we teach different groups within our organization to learn. It’s evolved from over the past four years from having nothing and siloed data sets of spreadsheets and everyone doing their own thing, to being centralized based on KPIs and the trust in what they receive from the data.
BI software helps companies do just that by shepherding the right data into analytical reports and visualizations so that users can make informed decisions. To gain employee buy-in, Stout’s team builds BI dashboards to show them how they can easily connect to and interact with their data, as well as visualize it in a meaningful way.
With AWS Glue, you can discover and connect to hundreds of diverse data sources and manage your data in a centralized data catalog. It enables you to visually create, run, and monitor extract, transform, and load (ETL) pipelines to load data into your datalakes. Select Visual ETL in the central pane.
We had been talking about “Agile Analytic Operations,” “DevOps for Data Teams,” and “Lean Manufacturing For Data,” but the concept was hard to get across and communicate. I spent much time de-categorizing DataOps: we are not discussing ETL, DataLake, or Data Science.
In this post, we discuss how you can use purpose-built AWS services to create an end-to-end data strategy for C360 to unify and govern customer data that address these challenges. Strategize based on how your teams explore data, run analyses, wrangle data for downstream requirements, and visualizedata at different levels.
This past week, I had the pleasure of hosting DataGovernance for Dummies author Jonathan Reichental for a fireside chat , along with Denise Swanson , DataGovernance lead at Alation. Can you have proper data management without establishing a formal datagovernance program?
A data hub is a center of data exchange that constitutes a hub of data repositories and is supported by data engineering, datagovernance, security, and monitoring services. A data hub contains data at multiple levels of granularity and is often not integrated.
To bring their customers the best deals and user experience, smava follows the modern data architecture principles with a datalake as a scalable, durable data store and purpose-built data stores for analytical processing and data consumption. This is the Data Mart stage.
The layer cake metaphor shifts the data discussion from an IT discussion to the intersection of business strategy and technology. So it’s about how we create layers from the business concept, like advancing discovery, all the way down to a technology solution, like a visualization tool. Does the data live in one or many clouds?
With each game release and update, the amount of unstructured data being processed grows exponentially, Konoval says. This volume of data poses serious challenges in terms of storage and efficient processing,” he says. To address this problem RetroStyle Games invested in datalakes. Ensure value with visualizations.
This allows business analysts and decision-makers to gain valuable insights, visualize key metrics, and explore the data in depth, enabling informed decision-making and strategic planning for pricing and promotional strategies. On the Visual tab, choose Add nodes. Choose Data source – Snowflake in the AWS Glue Studio canvas.
Amazon Redshift enables data warehousing by seamlessly integrating with other data stores and services in the modern data organization through features such as Zero-ETL , data sharing , streaming ingestion , datalake integration , and Redshift ML.
The data fabric architectural approach can simplify data access in an organization and facilitate self-service data consumption at scale. Read: The first capability of a data fabric is a semantic knowledge data catalog, but what are the other 5 core capabilities of a data fabric? 11 May 2021. .
Data Pipeline Use Cases Here are just a few examples of the goals you can achieve with a robust data pipeline: Data Prep for VisualizationData pipelines can facilitate easier datavisualization by gathering and transforming the necessary data into a usable state.
The solution uses AWS services such as AWS HealthLake , Amazon Redshift , Amazon Kinesis Data Streams , and AWS Lake Formation to build a 360 view of patients. This means you no longer have to create an external schema in Amazon Redshift to use the datalake tables cataloged in the Data Catalog.
Previously, there were three types of data structures in telco: . Entity data sets — i.e. marketing datalakes . There are three major architectures under the modern data architecture umbrella. . Application-based datasets — i.e. billing or contact center support systems .
This enables the user to create a datalake environment with AWS Glue database and Athena workgroup to query the data. Because SageMaker Unified Studio is in preview mode, the naming conventions of some visual elements might appear different in the current version. She can be reached via LinkedIn.
In addition, the foundation role monitors the state of the metadata, data quality indicators, data permissions, information classification labels, and so on. It is crucial in datagovernance and data management. BI and visualization Individual consumers have a dedicated space in a BI tool.
Accounting for the complexities of the AI lifecycle Unfortunately, typical data storage and datagovernance tools fall short in the AI arena when it comes to helping an organization perform the tasks that underline efficient and responsible AI lifecycle management. And that makes sense.
Paco Nathan ‘s latest column dives into datagovernance. This month’s article features updates from one of the early data conferences of the year, Strata Data Conference – which was held just last week in San Francisco. In particular, here’s my Strata SF talk “Overview of DataGovernance” presented in article form.
After that came datagovernance , privacy, and compliance staff. Power business users and other non-purely-analytic data citizens came after that. Analysts didn’t just want to catalog data sources, they wanted to include dashboards, reports, and visualizations. Data engineers want to catalog data pipelines.
In this four-part blog series on data culture, we’re exploring what a data culture is and the benefits of building one, and then drilling down to explore each of the three pillars of data culture – data search & discovery, data literacy, and datagovernance – in more depth.
But only a data catalog built as a platform can empower people to find, understand, and governdata, and support emerging data intelligence use cases. Alation possesses three unique capabilities: intelligence, active datagovernance, and broad, deep connectivity. Active DataGovernance.
Semantics, context, and how data is tracked and used mean even more as you stretch to reach post-migration goals. This is why, when data moves, it’s imperative for organizations to prioritize data discovery. Data discovery is also critical for datagovernance , which, when ineffective, can actually hinder organizational growth.
A data catalog is a centralized storage bank of metadata on information sources from across the enterprise, such as: Datasets. Visualizations. The data catalog also stores metadata (data about data, like a conversation), which gives users context on how to use each asset. Data Catalog by Type. Conversations.
In this episode I’ll cover themes from Sci Foo and important takeaways that data science teams should be tracking. First and foremost: there’s substantial overlap between what the scientific community is working toward for scholarly infrastructure and some of the current needs of datagovernance in industry. We did it again.”.
For example, a Jupyter notebook in CML, can use Spark or Python framework to directly access an Iceberg table to build a forecast model, while new data is ingested via NiFi flows, and a SQL analyst monitors revenue targets using DataVisualization. 2: Open formats. Flexible and open file formats. Open the door to new use-cases.
We organize all of the trending information in your field so you don't have to. Join 42,000+ users and stay up to date on the latest articles your peers are reading.
You know about us, now we want to get to know you!
Let's personalize your content
Let's get even more personalized
We recognize your account from another site in our network, please click 'Send Email' below to continue with verifying your account and setting a password.


Let's personalize your content