This site uses cookies to improve your experience. To help us insure we adhere to various privacy regulations, please select your country/region of residence. If you do not select a country, we will assume you are from the United States. Select your Cookie Settings or view our Privacy Policy and Terms of Use.
Cookie Settings
Cookies and similar technologies are used on this website for proper function of the website, for tracking performance analytics and for marketing purposes. We and some of our third-party providers may use cookie data for various purposes. Please review the cookie settings below and choose your preference.
Used for the proper function of the website
Used for monitoring website traffic and interactions
Cookie Settings
Cookies and similar technologies are used on this website for proper function of the website, for tracking performance analytics and for marketing purposes. We and some of our third-party providers may use cookie data for various purposes. Please review the cookie settings below and choose your preference.
Strictly Necessary: Used for the proper function of the website
Performance/Analytics: Used for monitoring website traffic and interactions
A scalable data architecture should be able to scale up (adding more resources or processing power to individual machines) and to scale out (adding more machines to distribute the load of the database). Flexible data architectures can integrate new data sources, incorporate new technologies, and evolve with business needs.
Data analytics draws from a range of disciplines — including computer programming, mathematics, and statistics — to perform analysis on data in an effort to describe, predict, and improve performance. What are the four types of data analytics? Data analytics includes the tools and techniques used to perform data analysis.
I t is interesting to see that dataintegration between on-premises and cloud applications is ranked an equally important use case across all company sizes while dataintegration between cloud applications becomes more important the smaller the company is. BI and Data Management in the Cloud Report.
Each of that component has its own purpose that we will discuss in more detail while concentrating on data warehousing. A solid BI architecture framework consists of: Collection of data. Dataintegration. Storage of data. Data analysis. Distribution of data. Dataintegration.
It stores the data of every partner business entity in an exclusive micro-DB while storing millions of databases. It moves the data at a massive scale thereby attesting dataintegrity and speedier delivery. Data Pipeline: Use Cases. With the growth of big data, data management is now an ever-increasing priority.
And it’s data, and property binding requires too much time to fix in the report. KNIME is an open-source BI tool specialized for data linkage, integration, and analysis. From Google. Pentaho Community Edition .
The development of business intelligence to analyze and extract value from the countless sources of data that we gather at a high scale, brought alongside a bunch of errors and low-quality reports: the disparity of data sources and data types added some more complexity to the dataintegration process.
In addition, data warehouse provides a data storage environment where data onto multiple data sources will be ETLed(Extracted, Transformed, Dunked) , cleaned up, and stored on a specific topic, indicating powerful dataintegration and maintenance capabilities of BI. Data Analysis. DataMining.
The Business Application Research Center (BARC) warns that data governance is a highly complex, ongoing program, not a “big bang initiative,” and it runs the risk of participants losing trust and interest over time.
Although job descriptions will vary by company, according to a sample BI analyst job description from Indeed, general responsibilities for the role include: Review and validate customer data as it is collected Oversee deployment of data to a data warehouse Develop policies and procedures for the collection and analysis of data Create or discover new (..)
The underlying data is in charge of data management, covering data collection, ETL, building a data warehouse, etc. The data analysis part is responsible for extracting data from the data warehouse, using the query, OLAP, datamining to analyze data, and forming the data conclusion with data visualization.
FineReport was the solution for dataintegration, data visualization, data analysis, data query, data management, and data entry across the organization. Here I also put some reports and dashboards developed by FineReport. Profit center -dashborad (by FineReport). Interative Report (by FineReport).
Well, it is – to the ones that are 100% familiar with it – and it involves the use of various data sources, including internal data from company databases, as well as external data, to generate insights, identify trends, and support strategic planning. For a beginner, it’s a lot in one place.
The underlying data is responsible for data management, including data collection, ETL, building a data warehouse, etc. Data analysis is mainly about extracting data from the data warehouse and analyzing it with the analysis methods such as query, OLAP, datamining, and data visualization to form the data conclusion.
Datapine – Datapine connects all your data sources in a unified location and creates detailed visualizations to help businesses comprehend their data better. It provides reporting including web-based reports and dashboards, dataintegration tools and data visualization. The tool is simple and easy to use.
Dataintegration stands as a critical first step in constructing any artificial intelligence (AI) application. While various methods exist for starting this process, organizations accelerate the application development and deployment process through data virtualization. Why choose data virtualization?
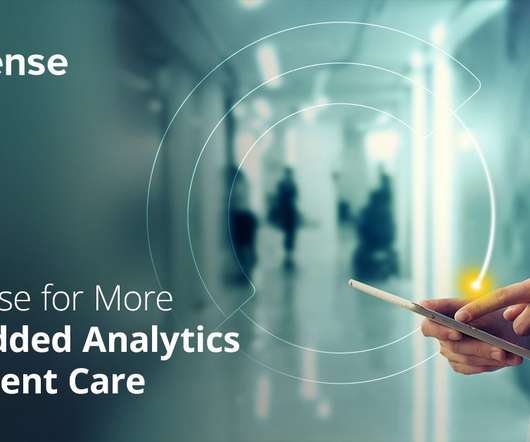
The steady growth of medical data is outpacing many health providers’ ability to make use of it. Datamining and analytics tools previously used for commercial data are being applied to medical data in various forms. Embedded patient analytics analyze medical data from many sources in one place.
This mountain of data holds a gold rush of opportunities for marketers to truly engage with their consumers, just as long as they can effectively mine through all that data and make sense of what really matters.
Acting as a comprehensive solution, the best BI tools collect and analyze company data to generate easily interpretable graphs, reports, and charts , leveraging advanced datamining, analytics, and visualization techniques.
Datapine – Datapine connects all your data sources in a unified location and creates detailed visualizations to help businesses comprehend their data better. It provides reporting including web-based reports and dashboards, dataintegration tools and data visualization. The tool is simple and easy to use.
FineReport was the solution for dataintegration, data visualization, data analysis, data query, data management, and data entry across the organization. Here I also put some reports and dashboards developed by FineReport. Profit center -dashborad (by FineReport). Interative Report (by FineReport).
It quickly processes large amounts of data from internal and external sources, so users can recognize patterns and gain deeper insights to make better decisions. It runs statistics and algorithms (also known as datamining) on masses of historical data to calculate probabilities and future events. advanced analytics.
In addition to security concerns, achieving seamless healthcare dataintegration and interoperability presents its own set of challenges. The fragmented nature of healthcare systems often results in disparate data sources that hinder efficient decision-making processes.
Key features: Data analysts use Python to realize the functions like data crawling, data cleaning, data modeling, data visualization, datamining, etc. In addition, you can choose to use charts provided by KNIME or customize the charts according to your own needs to visualize your data.
Datapine – Datapine connects all your data sources in a unified location and creates detailed visualizations to help businesses comprehend their data better. It provides reporting including web-based reports and dashboards, dataintegration tools and data visualization. The tool is simple and easy to use.
Datapine – Datapine connects all your data sources in a unified location and creates detailed visualizations to help businesses comprehend their data better. It provides reporting including web-based reports and dashboards, dataintegration tools and data visualization. The tool is simple and easy to use.
RapidMiner RapidMiner is an excellent open-source tool for Big Data Analytics that can handle data preparation, model development, and deployment, as well as custom datamining methods and predictive setup analysis through a series of add-ons. Here are the key features of Talend: Streamlines ETL and ELT for big data.
Before implementing a data lake on AWS, Ruparupa had no infrastructure capable of processing the volume and variety of data formats in a short time. Data had to be manually processed by data analysts, and datamining took a long time. Because of the fast growth of data, it took 1–1.5
So, make sure you have a data strategy in place. DataIntegration. The easiest way to tap into data is integrating all your data to get a detailed understanding of your operations and your customers. Datamining. Datamining allows refining and analyzing of the data on a near-real time basis.
Statistics are infamous for their ability and potential to exist as misleading and bad data. Exclusive Bonus Content: Download Our Free DataIntegrity Checklist. Get our free checklist on ensuring data collection and analysis integrity! Exclusive Bonus Content: Download Our Free DataIntegrity Checklist.
Batch processing pipelines are designed to decrease workloads by handling large volumes of data efficiently and can be useful for tasks such as data transformation, data aggregation, dataintegration , and data loading into a destination system. What is the difference between ETL and data pipeline?
The Challenges of Extracting Enterprise Data Currently, various use cases require data extraction from your OCA ERP, including data warehousing, data harmonization, feeding downstream systems for analytical or operational purposes, leveraging datamining, predictive analysis, and AI-driven or augmented BI disciplines.
Users Want to Help Themselves Datamining is no longer confined to the research department. Today, every professional has the power to be a “data expert.” Bid Goodbye to Standalone Users don’t want to have to leave their app or call IT for insights. Standalone is a thing of the past.
We organize all of the trending information in your field so you don't have to. Join 42,000+ users and stay up to date on the latest articles your peers are reading.
You know about us, now we want to get to know you!
Let's personalize your content
Let's get even more personalized
We recognize your account from another site in our network, please click 'Send Email' below to continue with verifying your account and setting a password.


Let's personalize your content