Remove Data Integration Remove Data Quality Remove Interactive Remove Predictive Analytics
article thumbnail

Innovative data integration in 2024: Pioneering the future of data integration

CIO Business Intelligence

In the age of big data, where information is generated at an unprecedented rate, the ability to integrate and manage diverse data sources has become a critical business imperative. Traditional data integration methods are often cumbersome, time-consuming, and unable to keep up with the rapidly evolving data landscape.

article thumbnail

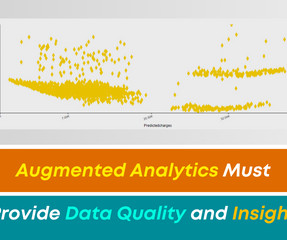
Augmented Analytics Must Provide Data Quality and Insight!

Smarten

How Can I Ensure Data Quality and Gain Data Insight Using Augmented Analytics? There are many business issues surrounding the use of data to make decisions. One such issue is the inability of an organization to gather and analyze data.

Insiders

Sign Up for our Newsletter

This site is protected by reCAPTCHA and the Google Privacy Policy and Terms of Service apply.

article thumbnail

Hyper-Personalization in Banking: Principles, Applications, Benefits, and Best Practices

Data Virtualization

Reading Time: 2 minutes In the dynamic arena of banking, hyper-personalization emerges as a beacon of innovation, reshaping customer interactions in profound ways.

article thumbnail

10 Best Big Data Analytics Tools You Need To Know in 2023

FineReport

Descriptive Analytics is used to determine “what happened and why.” ” This type of Analytics includes traditional query and reporting settings with scorecards and dashboards. Here are the key features of RapidMiner: Offers a variety of data management approaches. Offers interactive and shared dashboards.

article thumbnail

Create an end-to-end data strategy for Customer 360 on AWS

AWS Big Data

Customer 360 (C360) provides a complete and unified view of a customer’s interactions and behavior across all touchpoints and channels. This view is used to identify patterns and trends in customer behavior, which can inform data-driven decisions to improve business outcomes. Then, you transform this data into a concise format.

article thumbnail

15 Best Data Analysis Tools You Can’t Miss in 2022

FineReport

Key features: It supports connecting to almost all mainstream data sources so that you can analyze data from different sources in just one single report or dashboard. It is also professional in data visualization with multiple pre-defined dashboards templates and various types of charts, such as dynamic charts and maps.

article thumbnail

Top 10 Analytics And Business Intelligence Trends For 2020

datapine

Data exploded and became big. Spreadsheets finally took a backseat to actionable and insightful data visualizations and interactive business dashboards. The rise of self-service analytics democratized the data product chain. Suddenly advanced analytics wasn’t just for the analysts.