This site uses cookies to improve your experience. To help us insure we adhere to various privacy regulations, please select your country/region of residence. If you do not select a country, we will assume you are from the United States. Select your Cookie Settings or view our Privacy Policy and Terms of Use.
Cookie Settings
Cookies and similar technologies are used on this website for proper function of the website, for tracking performance analytics and for marketing purposes. We and some of our third-party providers may use cookie data for various purposes. Please review the cookie settings below and choose your preference.
Used for the proper function of the website
Used for monitoring website traffic and interactions
Cookie Settings
Cookies and similar technologies are used on this website for proper function of the website, for tracking performance analytics and for marketing purposes. We and some of our third-party providers may use cookie data for various purposes. Please review the cookie settings below and choose your preference.
Strictly Necessary: Used for the proper function of the website
Performance/Analytics: Used for monitoring website traffic and interactions
The Race For DataQuality In A Medallion Architecture The Medallion architecture pattern is gaining traction among data teams. It is a layered approach to managing and transforming data. It sounds great, but how do you prove the data is correct at each layer? How do you ensure dataquality in every layer ?
Data Observability and DataQuality Testing Certification Series We are excited to invite you to a free four-part webinar series that will elevate your understanding and skills in Data Observation and DataQuality Testing. Don’t miss this opportunity to transform your data practices.
To improve data reliability, enterprises were largely dependent on data-quality tools that required manual effort by data engineers, data architects, data scientists and data analysts. With the aim of rectifying that situation, Bigeye’s founders set out to build a business around data observability.
As technology and business leaders, your strategic initiatives, from AI-powered decision-making to predictive insights and personalized experiences, are all fueled by data. Yet, despite growing investments in advanced analytics and AI, organizations continue to grapple with a persistent and often underestimated challenge: poor dataquality.
They made us realise that building systems, processes and procedures to ensure quality is built in at the outset is far more cost effective than correcting mistakes once made. How about dataquality? Redman and David Sammon, propose an interesting (and simple) exercise to measuredataquality.
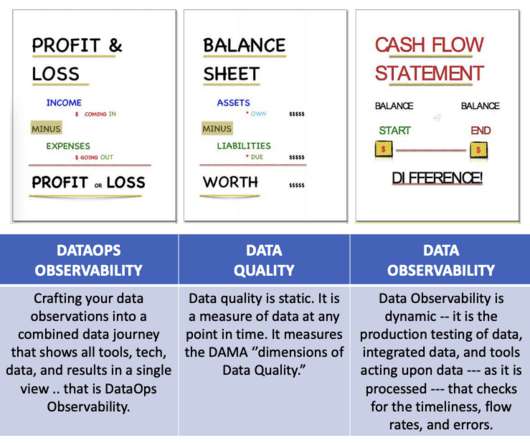
Question: What is the difference between DataQuality and Observability in DataOps? DataQuality is static. It is the measure of data sets at any point in time. A financial analogy: DataQuality is your Balance Sheet, Data Observability is your Cash Flow Statement.
Thousands of organizations build dataintegration pipelines to extract and transform data. They establish dataquality rules to ensure the extracted data is of high quality for accurate business decisions. After a few months, daily sales surpassed 2 million dollars, rendering the threshold obsolete.
Machine learning solutions for dataintegration, cleaning, and data generation are beginning to emerge. “AI AI starts with ‘good’ data” is a statement that receives wide agreement from data scientists, analysts, and business owners. Dataintegration and cleaning. Data unification and integration.
Hundreds of thousands of organizations build dataintegration pipelines to extract and transform data. They establish dataquality rules to ensure the extracted data is of high quality for accurate business decisions. We also show how to take action based on the dataquality results.
In the age of big data, where information is generated at an unprecedented rate, the ability to integrate and manage diverse data sources has become a critical business imperative. Traditional dataintegration methods are often cumbersome, time-consuming, and unable to keep up with the rapidly evolving data landscape.
When we talk about dataintegrity, we’re referring to the overarching completeness, accuracy, consistency, accessibility, and security of an organization’s data. Together, these factors determine the reliability of the organization’s data. In short, yes.
We are excited to announce the General Availability of AWS Glue DataQuality. Our journey started by working backward from our customers who create, manage, and operate data lakes and data warehouses for analytics and machine learning. It takes days for data engineers to identify and implement dataquality rules.
Companies are no longer wondering if data visualizations improve analyses but what is the best way to tell each data-story. 2020 will be the year of dataquality management and data discovery: clean and secure data combined with a simple and powerful presentation. 1) DataQuality Management (DQM).
RightData – A self-service suite of applications that help you achieve DataQuality Assurance, DataIntegrity Audit and Continuous DataQuality Control with automated validation and reconciliation capabilities. QuerySurge – Continuously detect data issues in your delivery pipelines. Data breaks.
AWS Glue is a serverless dataintegration service that makes it simple to discover, prepare, and combine data for analytics, machine learning (ML), and application development. Hundreds of thousands of customers use data lakes for analytics and ML to make data-driven business decisions.
Several weeks ago (prior to the Omicron wave), I got to attend my first conference in roughly two years: Dataversity’s DataQuality and Information Quality Conference. Ryan Doupe, Chief Data Officer of American Fidelity, held a thought-provoking session that resonated with me. Step 2: Data Definitions.
It’s also a critical trait for the data assets of your dreams. What is data with integrity? Dataintegrity is the extent to which you can rely on a given set of data for use in decision-making. Where can dataintegrity fall short? Too much or too little access to data systems.
It expanded its focus to address wider dataintegration and data management challenges, including master data management, dataquality and data governance. Informatica is still closely associated with dataintegration.
An automated process that catches errors early in the process gives the data team the maximum available time to resolve the problem – patch the data, contact data suppliers, and rerun processing steps. The measurement and monitoring of your end-to-end process can serve as an important tool in the battle to eliminate errors.
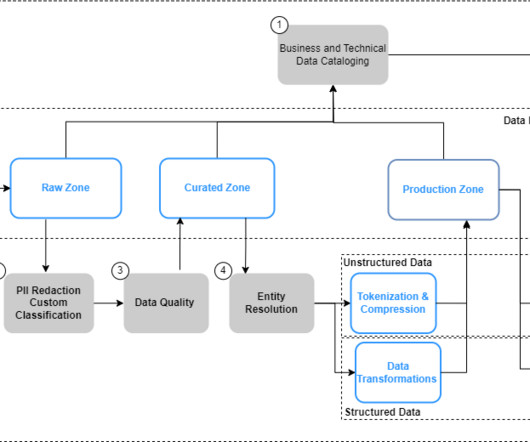
These layers help teams delineate different stages of data processing, storage, and access, offering a structured approach to data management. In the context of Data in Place, validating dataquality automatically with Business Domain Tests is imperative for ensuring the trustworthiness of your data assets.
But in the four years since it came into force, have companies reached their full potential for dataintegrity? But firstly, we need to look at how we define dataintegrity. What is dataintegrity? Many confuse dataintegrity with dataquality. Is integrity a universal truth?
Have you ever experienced that sinking feeling, where you sense if you don’t find dataquality, then dataquality will find you? These discussions are a critical prerequisite for determining data usage, standards, and the business relevant metrics for measuring and improving dataquality.
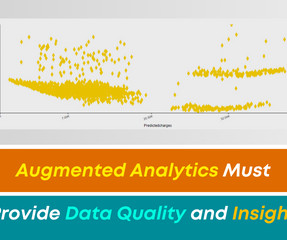
How Can I Ensure DataQuality and Gain Data Insight Using Augmented Analytics? There are many business issues surrounding the use of data to make decisions. One such issue is the inability of an organization to gather and analyze data.
cycle_end";') con.close() With this, as the data lands in the curated data lake (Amazon S3 in parquet format) in the producer account, the data science and AI teams gain instant access to the source data eliminating traditional delays in the data availability.
The Second of Five Use Cases in Data Observability Data Evaluation: This involves evaluating and cleansing new datasets before being added to production. This process is critical as it ensures dataquality from the onset. Examples include regular loading of CRM data and anomaly detection.
When implementing automated validation, AI-driven regression testing, real-time canary pipelines, synthetic data generation, freshness enforcement, KPI tracking, and CI/CD automation, organizations can shift from reactive data observability to proactive dataquality assurance.
Poor dataquality is one of the top barriers faced by organizations aspiring to be more data-driven. Ill-timed business decisions and misinformed business processes, missed revenue opportunities, failed business initiatives and complex data systems can all stem from dataquality issues.
Companies rely heavily on data and analytics to find and retain talent, drive engagement, improve productivity and more across enterprise talent management. However, analytics are only as good as the quality of the data, which must be error-free, trustworthy and transparent. What is dataquality? million each year.
Residuals are a numeric measurement of model errors, essentially the difference between the model’s prediction and the known true outcome. Residual plots place input data and predictions into a two-dimensional visualization where influential outliers, data-quality problems, and other types of bugs often become plainly visible.
What is DataQuality? Dataquality is defined as: the degree to which data meets a company’s expectations of accuracy, validity, completeness, and consistency. By tracking dataquality , a business can pinpoint potential issues harming quality, and ensure that shared data is fit to be used for a given purpose.
The Business Application Research Center (BARC) warns that data governance is a highly complex, ongoing program, not a “big bang initiative,” and it runs the risk of participants losing trust and interest over time. Informatica Axon Informatica Axon is a collection hub and data marketplace for supporting programs.
This includes defining the main stakeholders, assessing the situation, defining the goals, and finding the KPIs that will measure your efforts to achieve these goals. A planned BI strategy will point your business in the right direction to meet its goals by making strategic decisions based on real-time data. It’s that simple.
Your LLM Needs a Data Journey: A Comprehensive Guide for Data Engineers The rise of Large Language Models (LLMs) such as GPT-4 marks a transformative era in artificial intelligence, heralding new possibilities and challenges in equal measure.
Here, I’ll highlight the where and why of these important “dataintegration points” that are key determinants of success in an organization’s data and analytics strategy. Layering technology on the overall data architecture introduces more complexity. Data and cloud strategy must align.
While compliance is the major driver for data governance, it bears the risk of reducing it to a very restrictive procedure. Dataquality is the top challenge when it comes to using data, closely followed by organizational issues. Inadequate dataquality remains the foremost challenge users face when using data.
Working with large language models (LLMs) for enterprise use cases requires the implementation of quality and privacy considerations to drive responsible AI. However, enterprise data generated from siloed sources combined with the lack of a dataintegration strategy creates challenges for provisioning the data for generative AI applications.
Then virtualize your data to allow business users to conduct aggregated searches and analyses using the business intelligence or data analytics tools of their choice. . Set up unified data governance rules and processes. With dataintegration comes a requirement for centralized, unified data governance and security.
Currently, no standardized process exists for overcoming data ingestion’s challenges, but the model’s accuracy depends on it. Increased variance: Variance measures consistency. Insufficient data can lead to varying answers over time, or misleading outliers, particularly impacting smaller data sets.
That’s where MDM comes in to help create a single version of truth across all copies of master data to ensure data values are aligned. Certifications measure your knowledge and skills against industry- and vendor-specific benchmarks to prove to employers you have the right skillset. Informatica Master Data Management 10.3
As we zeroed in on the bottlenecks of day-to-day operations, 25 percent of respondents said length of project/delivery time was the most significant challenge, followed by dataquality/accuracy is next at 24 percent, time to value at 16 percent, and reliance on developer and other technical resources at 13 percent.
This ensures that each change is tracked and reversible, enhancing data governance and auditability. History and versioning : Iceberg’s versioning feature captures every change in table metadata as immutable snapshots, facilitating dataintegrity, historical views, and rollbacks.
Dataintegration If your organization’s idea of dataintegration is printing out multiple reports and manually cross-referencing them, you might not be ready for a knowledge graph. How do you measure its utility? RDF pipelines You also need to ensure you’ve got quality in your RDF pipeline.
DataOps observability involves the use of various tools and techniques to monitor the performance of data pipelines, data lakes, and other data-related infrastructure. This can include the use of tools for dataintegration and transformation, as well as technologies for managing and monitoring data-related systems and processes.
Another way to look at the five pillars is to see them in the context of a typical complex data estate. Monitoring is another pillar of Data Journeys, extending down the stack. Moreover, cost monitoring ensures that your data operations stay within budget and that resources are used efficiently.
We organize all of the trending information in your field so you don't have to. Join 42,000+ users and stay up to date on the latest articles your peers are reading.
You know about us, now we want to get to know you!
Let's personalize your content
Let's get even more personalized
We recognize your account from another site in our network, please click 'Send Email' below to continue with verifying your account and setting a password.


Let's personalize your content