This site uses cookies to improve your experience. To help us insure we adhere to various privacy regulations, please select your country/region of residence. If you do not select a country, we will assume you are from the United States. Select your Cookie Settings or view our Privacy Policy and Terms of Use.
Cookie Settings
Cookies and similar technologies are used on this website for proper function of the website, for tracking performance analytics and for marketing purposes. We and some of our third-party providers may use cookie data for various purposes. Please review the cookie settings below and choose your preference.
Used for the proper function of the website
Used for monitoring website traffic and interactions
Cookie Settings
Cookies and similar technologies are used on this website for proper function of the website, for tracking performance analytics and for marketing purposes. We and some of our third-party providers may use cookie data for various purposes. Please review the cookie settings below and choose your preference.
Strictly Necessary: Used for the proper function of the website
Performance/Analytics: Used for monitoring website traffic and interactions
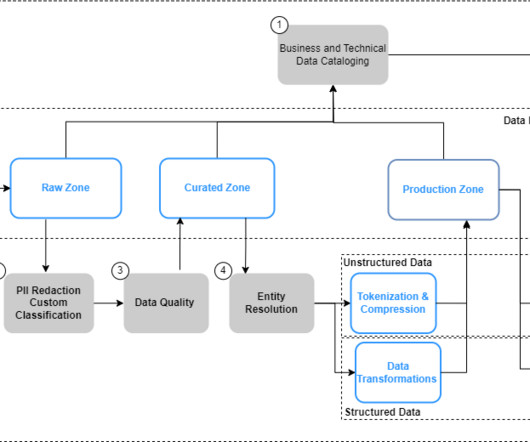
The Race For DataQuality In A Medallion Architecture The Medallion architecture pattern is gaining traction among data teams. It is a layered approach to managing and transforming data. It sounds great, but how do you prove the data is correct at each layer? How do you ensure dataquality in every layer ?
Data Observability and DataQuality Testing Certification Series We are excited to invite you to a free four-part webinar series that will elevate your understanding and skills in Data Observation and DataQuality Testing. Slides and recordings will be provided.
With the growing emphasis on data, organizations are constantly seeking more efficient and agile ways to integrate their data, especially from a wide variety of applications. We take care of the ETL for you by automating the creation and management of data replication. What’s the difference between zero-ETL and Glue ETL?
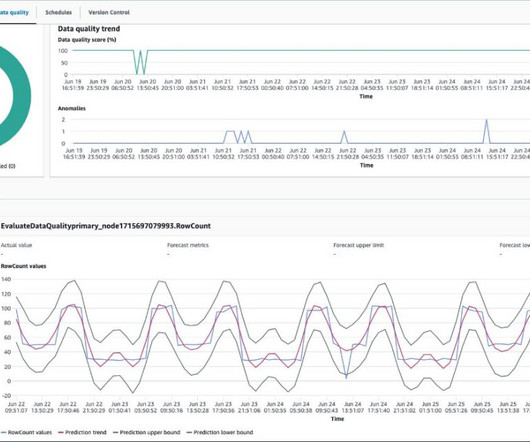
Thousands of organizations build dataintegration pipelines to extract and transform data. They establish dataquality rules to ensure the extracted data is of high quality for accurate business decisions. After a few months, daily sales surpassed 2 million dollars, rendering the threshold obsolete.
As technology and business leaders, your strategic initiatives, from AI-powered decision-making to predictive insights and personalized experiences, are all fueled by data. Yet, despite growing investments in advanced analytics and AI, organizations continue to grapple with a persistent and often underestimated challenge: poor dataquality.
Hundreds of thousands of organizations build dataintegration pipelines to extract and transform data. They establish dataquality rules to ensure the extracted data is of high quality for accurate business decisions. We also show how to take action based on the dataquality results.
We are excited to announce the General Availability of AWS Glue DataQuality. Our journey started by working backward from our customers who create, manage, and operate data lakes and data warehouses for analytics and machine learning. It takes days for data engineers to identify and implement dataquality rules.
RightData – A self-service suite of applications that help you achieve DataQuality Assurance, DataIntegrity Audit and Continuous DataQuality Control with automated validation and reconciliation capabilities. QuerySurge – Continuously detect data issues in your delivery pipelines. Data breaks.
Several weeks ago (prior to the Omicron wave), I got to attend my first conference in roughly two years: Dataversity’s DataQuality and Information Quality Conference. Ryan Doupe, Chief Data Officer of American Fidelity, held a thought-provoking session that resonated with me. Step 2: Data Definitions.
Companies are no longer wondering if data visualizations improve analyses but what is the best way to tell each data-story. 2020 will be the year of dataquality management and data discovery: clean and secure data combined with a simple and powerful presentation. 1) DataQuality Management (DQM).
AWS Glue is a serverless dataintegration service that makes it simple to discover, prepare, and combine data for analytics, machine learning (ML), and application development. Hundreds of thousands of customers use data lakes for analytics and ML to make data-driven business decisions.
These layers help teams delineate different stages of data processing, storage, and access, offering a structured approach to data management. In the context of Data in Place, validating dataquality automatically with Business Domain Tests is imperative for ensuring the trustworthiness of your data assets.
Extrinsic Control Deficit: Many of these changes stem from tools and processes beyond the immediate control of the data team. Unregulated ETL/ELT Processes: The absence of stringent dataquality tests in ETL (Extract, Transform, Load) or ELT (Extract, Load, Transform) processes further exacerbates the problem.
In this blog post, we’ll discuss how the metadata layer of Apache Iceberg can be used to make data lakes more efficient. You will learn about an open-source solution that can collect important metrics from the Iceberg metadata layer. This ensures that each change is tracked and reversible, enhancing data governance and auditability.
Have you ever experienced that sinking feeling, where you sense if you don’t find dataquality, then dataquality will find you? These discussions are a critical prerequisite for determining data usage, standards, and the business relevant metrics for measuring and improving dataquality.
The Third of Five Use Cases in Data Observability Data Evaluation: This involves evaluating and cleansing new datasets before being added to production. This process is critical as it ensures dataquality from the onset. Examples include regular loading of CRM data and anomaly detection.
cycle_end";') con.close() With this, as the data lands in the curated data lake (Amazon S3 in parquet format) in the producer account, the data science and AI teams gain instant access to the source data eliminating traditional delays in the data availability.
Residual plots place input data and predictions into a two-dimensional visualization where influential outliers, data-quality problems, and other types of bugs often become plainly visible. For model training and selection, we recommend considering fairness metrics when selecting hyperparameters and decision cutoff thresholds.
When implementing automated validation, AI-driven regression testing, real-time canary pipelines, synthetic data generation, freshness enforcement, KPI tracking, and CI/CD automation, organizations can shift from reactive data observability to proactive dataquality assurance.
In a sea of questionable data, how do you know what to trust? Dataquality tells you the answer. It signals what data is trustworthy, reliable, and safe to use. It empowers engineers to oversee data pipelines that deliver trusted data to the wider organization. Today, as part of its 2022.2
Some will argue that observability is nothing more than testing and monitoring applications using tests, metrics, logs, and other artifacts. That’s a fair point, and it places emphasis on what is most important – what best practices should data teams employ to apply observability to data analytics. It’s not about dataquality .
What is DataQuality? Dataquality is defined as: the degree to which data meets a company’s expectations of accuracy, validity, completeness, and consistency. By tracking dataquality , a business can pinpoint potential issues harming quality, and ensure that shared data is fit to be used for a given purpose.
The Matillion dataintegration and transformation platform enables enterprises to perform advanced analytics and business intelligence using cross-cloud platform-as-a-service offerings such as Snowflake. DataOps recommends that tests monitor data continuously in addition to checks performed when pipelines are run on demand.
Beyond mere data collection, BI consulting helps businesses create a cohesive data strategy that aligns with organizational goals. This approach involves everything from identifying key metrics to implementing analytics systems and designing dashboards.
Another way to look at the five pillars is to see them in the context of a typical complex data estate. Monitoring is another pillar of Data Journeys, extending down the stack. Moreover, cost monitoring ensures that your data operations stay within budget and that resources are used efficiently. Donkey: Oh, they have layers.
The application supports custom workflows to allow demand and supply planning teams to collaborate, plan, source, and fulfill customer orders, then track fulfillment metrics via persona-based operational and management reports and dashboards. The dataquality (DQ) checks are managed using DQ configurations stored in Aurora PostgreSQL tables.
Here, I’ll highlight the where and why of these important “dataintegration points” that are key determinants of success in an organization’s data and analytics strategy. Layering technology on the overall data architecture introduces more complexity. Data and cloud strategy must align.
Despite soundings on this from leading thinkers such as Andrew Ng , the AI community remains largely oblivious to the important data management capabilities, practices, and – importantly – the tools that ensure the success of AI development and deployment. Further, data management activities don’t end once the AI model has been developed.
Working with large language models (LLMs) for enterprise use cases requires the implementation of quality and privacy considerations to drive responsible AI. However, enterprise data generated from siloed sources combined with the lack of a dataintegration strategy creates challenges for provisioning the data for generative AI applications.
Data Journeys track and monitor all levels of the data stack, from data to tools to code to tests across all critical dimensions. A Data Journey supplies real-time statuses and alerts on start times, processing durations, test results, and infrastructure events, among other metrics.
Prior to the creation of the data lake, Orca’s data was distributed among various data silos, each owned by a different team with its own data pipelines and technology stack. Moreover, running advanced analytics and ML on disparate data sources proved challenging.
Dataquality for account and customer data – Altron wanted to enable dataquality and data governance best practices. Goals – Lay the foundation for a data platform that can be used in the future by internal and external stakeholders.
In 2022, AWS commissioned a study conducted by the American Productivity and Quality Center (APQC) to quantify the Business Value of Customer 360. The following figure shows some of the metrics derived from the study. Data exploration Data exploration helps unearth inconsistencies, outliers, or errors.
IT should be involved to ensure governance, knowledge transfer, dataintegrity, and the actual implementation. Clean data in, clean analytics out. Cleaning your data may not be quite as simple, but it will ensure the success of your BI. Indeed, every year low-qualitydata is estimated to cost over $9.7
With the help of Hawk-Eye, Statcast tracks and quantifies all manner of data: pitching (including velocity, spin rate and direction, and movement), hitting (exit velocity, launch angle, batted ball distance), running (sprint speed, base-to-base times), and fielding (arm strength, catch probability, catcher pop time).
Financial Performance Dashboard The financial performance dashboard provides a comprehensive overview of key metrics related to your balance sheet, shedding light on the efficiency of your capital expenditure. While sales dashboards focus on future prospects, accounting primarily focuses on analyzing the same metrics retrospectively.
For instance, aligning patient care data from Oracle databases with operational metrics from Power BI was daunting without clear data lineage. Different departments managed their data independently, leading to silos and inconsistencies. This led to better integration and consistency across the organization.
An HR dashboard functions as an advanced analytics tool that utilizes interactive data visualizations to present crucial HR metrics. Similar to various other business departments, human resources is gradually transforming into a data-centric function. Otherwise, it may become a ‘vanity metric’ in the HR dashboard.
Photo by Markus Spiske on Unsplash Introduction Senior data engineers and data scientists are increasingly incorporating artificial intelligence (AI) and machine learning (ML) into data validation procedures to increase the quality, efficiency, and scalability of data transformations and conversions.
Creating a single view of any data, however, requires the integration of data from disparate sources. Dataintegration is valuable for businesses of all sizes due to the many benefits of analyzing data from different sources. But dataintegration is not trivial. Establishes Trust in Data.
Key Influencer Analytics to understand interrelationships and impact of data columns with each other and target columns Sentiment Analysis This sophisticated analytical technique goes beyond quantitative questionnaires and surveys to capture the real opinions, feelings and sentiments of consumers, employees, and other stakeholders.
It has been well published since the State of DevOps 2019 DORA Metrics were published that with DevOps, companies can deploy software 208 times more often and 106 times faster, recover from incidents 2,604 times faster, and release 7 times fewer defects. Finally, dataintegrity is of paramount importance.
They are going to have different ways of combining numbers into metrics. We can almost guarantee you different results from each, and you end up with no dataintegrity whatsoever. Dataquality issues. Here’s the ugly truth: Everybody has a dataquality problem. Learn how to prepare your data for BI.
Security and privacy —When all data scientists and AI models are given access to data through a single point of entry, dataintegrity and security are improved. They can also spot and root out bias and drift proactively by monitoring, cataloging and governing their models.
We organize all of the trending information in your field so you don't have to. Join 42,000+ users and stay up to date on the latest articles your peers are reading.
You know about us, now we want to get to know you!
Let's personalize your content
Let's get even more personalized
We recognize your account from another site in our network, please click 'Send Email' below to continue with verifying your account and setting a password.


Let's personalize your content