This site uses cookies to improve your experience. To help us insure we adhere to various privacy regulations, please select your country/region of residence. If you do not select a country, we will assume you are from the United States. Select your Cookie Settings or view our Privacy Policy and Terms of Use.
Cookie Settings
Cookies and similar technologies are used on this website for proper function of the website, for tracking performance analytics and for marketing purposes. We and some of our third-party providers may use cookie data for various purposes. Please review the cookie settings below and choose your preference.
Used for the proper function of the website
Used for monitoring website traffic and interactions
Cookie Settings
Cookies and similar technologies are used on this website for proper function of the website, for tracking performance analytics and for marketing purposes. We and some of our third-party providers may use cookie data for various purposes. Please review the cookie settings below and choose your preference.
Strictly Necessary: Used for the proper function of the website
Performance/Analytics: Used for monitoring website traffic and interactions
Amazon Q dataintegration , introduced in January 2024, allows you to use natural language to author extract, transform, load (ETL) jobs and operations in AWS Glue specific data abstraction DynamicFrame. In this post, we discuss how Amazon Q dataintegrationtransforms ETL workflow development.
We are excited to announce a new capability of the AWS Glue Studio visual editor that offers a new visual user experience. Now you can author data preparation transformations and edit them with the AWS Glue Studio visual editor. Within the new experience, you can choose from hundreds of prebuilt transformations.
There are countless examples of big datatransforming many different industries. It can be used for something as visual as reducing traffic jams, to personalizing products and services, to improving the experience in multiplayer video games. We would like to talk about datavisualization and its role in the big data movement.
At Atlanta’s Hartsfield-Jackson International Airport, an IT pilot has led to a wholesale data journey destined to transform operations at the world’s busiest airport, fueled by machine learning and generative AI. That enables the analytics team using Power BI to create a single visualization for the GM.”
In addition to real-time analytics and visualization, the data needs to be shared for long-term data analytics and machine learning applications. This approach supports both the immediate needs of visualization tools such as Tableau and the long-term demands of digital twin and IoT data analytics.
Third, some services require you to set up and manage compute resources used for federated connectivity, and capabilities like connection testing and data preview arent available in all services. To solve for these challenges, we launched Amazon SageMaker Lakehouse unified data connectivity. Under Create job , choose Visual ETL.
Many AWS customers have integrated their data across multiple data sources using AWS Glue , a serverless dataintegration service, in order to make data-driven business decisions. Are there recommended approaches to provisioning components for dataintegration?
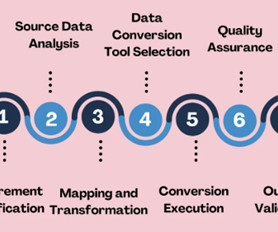
Selecting the strategies and tools for validating datatransformations and data conversions in your data pipelines. Introduction Datatransformations and data conversions are crucial to ensure that raw data is organized, processed, and ready for useful analysis.
In addition to using native managed AWS services that BMS didn’t need to worry about upgrading, BMS was looking to offer an ETL service to non-technical business users that could visually compose datatransformation workflows and seamlessly run them on the AWS Glue Apache Spark-based serverless dataintegration engine.
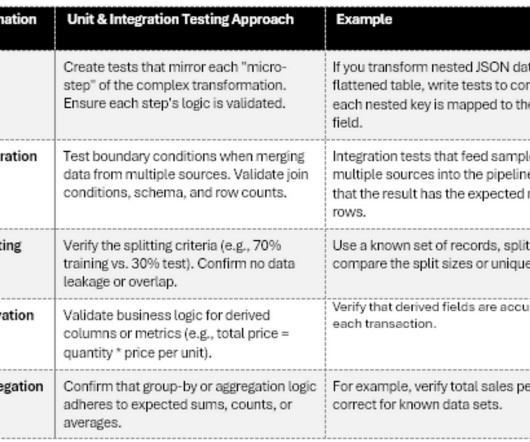
In this post, well see the fundamental procedures, tools, and techniques that data engineers, data scientists, and QA/testing teams use to ensure high-quality data as soon as its deployed. First, we look at how unit and integration tests uncover transformation errors at an early stage. Statistical tests (e.g.,
Data analytics draws from a range of disciplines — including computer programming, mathematics, and statistics — to perform analysis on data in an effort to describe, predict, and improve performance. What are the four types of data analytics? Data analytics and data science are closely related.
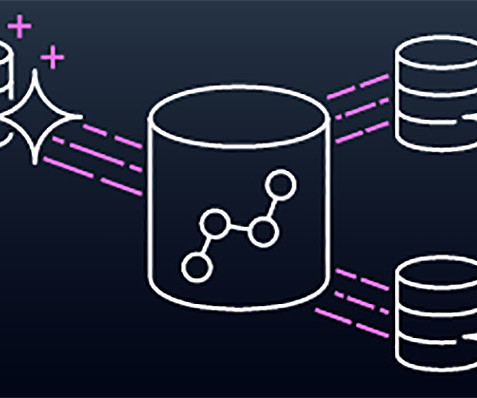
Dataintegration is the foundation of robust data analytics. It encompasses the discovery, preparation, and composition of data from diverse sources. In the modern data landscape, accessing, integrating, and transformingdata from diverse sources is a vital process for data-driven decision-making.
AI is transforming how senior data engineers and data scientists validate datatransformations and conversions. Artificial intelligence-based verification approaches aid in the detection of anomalies, the enforcement of dataintegrity, and the optimization of pipelines for improved efficiency.
In 2024, datavisualization companies play a pivotal role in transforming complex data into captivating narratives. This blog provides an insightful exploration of the leading entities shaping the datavisualization landscape.
Movement of data across data lakes, data warehouses, and purpose-built stores is achieved by extract, transform, and load (ETL) processes using dataintegration services such as AWS Glue. AWS Glue provides both visual and code-based interfaces to make dataintegration effortless.
The availability of machine-readable files opens up new possibilities for data analytics, allowing organizations to analyze large amounts of pricing data. Using machine learning (ML) and datavisualization tools, these datasets can be transformed into actionable insights that can inform decision-making.
Let’s go through the ten Azure data pipeline tools Azure Data Factory : This cloud-based dataintegration service allows you to create data-driven workflows for orchestrating and automating data movement and transformation. Azure Blob Storage serves as the data lake to store raw data.
In today’s data-driven world, seamless integration and transformation of data across diverse sources into actionable insights is paramount. With AWS Glue, you can discover and connect to hundreds of diverse data sources and manage your data in a centralized data catalog. Choose the Job details tab.
Hundreds of thousands of customers use AWS Glue , a serverless dataintegration service, to discover, prepare, and combine data for analytics, machine learning (ML), and application development. AWS Glue for Apache Spark jobs work with your code and configuration of the number of data processing units (DPU).
As organizations increasingly rely on data stored across various platforms, such as Snowflake , Amazon Simple Storage Service (Amazon S3), and various software as a service (SaaS) applications, the challenge of bringing these disparate data sources together has never been more pressing. Choose the Job details tab.
Many large organizations, in their desire to modernize with technology, have acquired several different systems with various data entry points and transformation rules for data as it moves into and across the organization. Business terms and data policies should be implemented through standardized and documented business rules.
It’s because it’s a hard thing to accomplish when there are so many teams, locales, data sources, pipelines, dependencies, datatransformations, models, visualizations, tests, internal customers, and external customers. You can’t quality-control your dataintegrations or reports with only some details.
For these, AWS Glue provides fast, scalable datatransformation. Third, AWS continues adding support for more data sources including connections to software as a service (SaaS) applications, on-premises applications, and other clouds so organizations can act on their data. Visit Dataintegration with AWS to learn more.
In today’s data-driven world, the ability to effortlessly move and analyze data across diverse platforms is essential. Amazon AppFlow , a fully managed dataintegration service, has been at the forefront of streamlining data transfer between AWS services, software as a service (SaaS) applications, and now Google BigQuery.
Rise in polyglot data movement because of the explosion in data availability and the increased need for complex datatransformations (due to, e.g., different data formats used by different processing frameworks or proprietary applications). As a result, alternative dataintegration technologies (e.g.,
In 2024, business intelligence (BI) software has undergone significant advancements, revolutionizing data management and decision-making processes. Harnessing the power of advanced APIs, automation, and AI, these tools simplify data compilation, organization, and visualization, empowering users to extract actionable insights effortlessly.
What if, experts asked, you could load raw data into a warehouse, and then empower people to transform it for their own unique needs? Today, dataintegration platforms like Rivery do just that. By pushing the T to the last step in the process, such products have revolutionized how data is understood and analyzed.
To share data to our internal consumers, we use AWS Lake Formation with LF-Tags to streamline the process of managing access rights across the organization. Dataintegration workflow A typical dataintegration process consists of ingestion, analysis, and production phases.
Additionally, the scale is significant because the multi-tenant data sources provide a continuous stream of testing activity, and our users require quick data refreshes as well as historical context for up to a decade due to compliance and regulatory demands. Finally, dataintegrity is of paramount importance.
Customers often use many SQL scripts to select and transform the data in relational databases hosted either in an on-premises environment or on AWS and use custom workflows to manage their ETL. AWS Glue is a serverless dataintegration and ETL service with the ability to scale on demand. Navigate to the Visual tab.
I am forgetting the other 25 features these tools provide for free. Additionally if you look at the massive progress these two tools have made in the last 24 months there is hardly anything, more like _nothing_, they can't do that other vendors, free or paid, can do.
That transformative offering is being leveraged by clients like Verizon Wireless, which taps Sisense to use anomaly detection analytics to stay ahead of potential failures in the network, and Air Canada , which uses our analytics to improve flight safety. Analytic builders of the world: Unite!
This is in contrast to traditional BI, which extracts insight from data outside of the app. We rely on increasingly mobile technology to comb through massive amounts of data and solve high-value problems. Plus, there is an expectation that tools be visually appealing to boot. Their dashboards were visually stunning.
Data mapping is essential for integration, migration, and transformation of different data sets; it allows you to improve your data quality by preventing duplications and redundancies in your data fields. Data mapping is important for several reasons.
Data Extraction : The process of gathering data from disparate sources, each of which may have its own schema defining the structure and format of the data and making it available for processing. This can include tasks such as data ingestion, cleansing, filtering, aggregation, or standardization.
Apache Iceberg is an open table format for huge analytic datasets designed to bring high-performance ACID (Atomicity, Consistency, Isolation, and Durability) transactions to big data. It provides a stable schema, supports complex datatransformations, and ensures atomic operations. What is Apache Iceberg?
Jet streamlines many aspects of data administration, greatly improving data solutions built on Microsoft Fabric. It enhances analytics capabilities, streamlines migration, and enhances dataintegration. Through Jet’s integration with Fabric, your organization can better handle, process, and use your data.
Complex Data Structures and Integration Processes Dynamics data structures are already complex – finance teams navigating Dynamics data frequently require IT department support to complete their routine reporting. With Atlas, you can put your data security concerns to rest.
More companies have realized there is an opportunity to integrate, enhance, and present this SaaS data to improve internal operations and gain valuable insights on their data. From there, they can perform meaningful analytics, gain valuable insights, and optionally push enriched data back to external SaaS platforms.
While efficiency is a priority, data quality and security remain non-negotiable. Developing and maintaining datatransformation pipelines are among the first tasks to be targeted for automation. However, caution is advised since accuracy, timeliness, and other aspects of data quality depend on the quality of data pipelines.
Gather/Insert data on market trends, customer behavior, inventory levels, or operational efficiency. IoT, Web Scraping, API, IDP, RPA Data Processing Data Pipelines and Analysis Layer Employ data pipelines with algorithms to filter, sort, and interpret data, transforming raw information into actionable insights.
Testing data and analytic systems require a development system with accurate test data, tools, and relevant tool code. Only then can you tell the true impact of a column name change on the datatransformations, the models, and the visualization you give to your customers.
We organize all of the trending information in your field so you don't have to. Join 42,000+ users and stay up to date on the latest articles your peers are reading.
You know about us, now we want to get to know you!
Let's personalize your content
Let's get even more personalized
We recognize your account from another site in our network, please click 'Send Email' below to continue with verifying your account and setting a password.


Let's personalize your content