This site uses cookies to improve your experience. To help us insure we adhere to various privacy regulations, please select your country/region of residence. If you do not select a country, we will assume you are from the United States. Select your Cookie Settings or view our Privacy Policy and Terms of Use.
Cookie Settings
Cookies and similar technologies are used on this website for proper function of the website, for tracking performance analytics and for marketing purposes. We and some of our third-party providers may use cookie data for various purposes. Please review the cookie settings below and choose your preference.
Used for the proper function of the website
Used for monitoring website traffic and interactions
Cookie Settings
Cookies and similar technologies are used on this website for proper function of the website, for tracking performance analytics and for marketing purposes. We and some of our third-party providers may use cookie data for various purposes. Please review the cookie settings below and choose your preference.
Strictly Necessary: Used for the proper function of the website
Performance/Analytics: Used for monitoring website traffic and interactions
As organizations shift from on-premise to cloud-based systems, they need solutions that simplify the transition and optimize data use with ease. Spreadsheet Server with our M3 Cloud Connector is designed to make your ERP dataintegration easy and frictionless, regardless of where your organization is in the cloud migration process.
The latest Angles for Oracle release continues to solve the biggest challenges associated with enterprise dataintegration by allowing users to access critical data and information through a single, cloud-accessible user interface. Angles for Oracle has been an integral part of our operationalreporting processes for 20 years.
The latest Angles for Oracle release continues to solve the biggest challenges associated with enterprise dataintegration by allowing users to access critical data and information through a single, cloud-accessible user interface. Angles for Oracle has been an integral part of our operationalreporting processes for 20 years.
Deal accelerates insightsoftware’s enterprise position in operationalreporting by adding market-leading data analytics and integration products including SAP and Oracle ERP reporting solutions. RALEIGH, N.C. The acquisition is expected to close in early November.
This Client required augmented analytics and reporting capabilities within the confines of the Healthcare Information System and Revenue tracking reports required by the industry standards and its management team. Key Benefits and Deliverables: Real-time report for Stocks, Sales, Returns, Regions etc., Download the Case study
AWS Glue is a serverless dataintegration service that helps analytics users to discover, prepare, move, and integratedata from multiple sources for analytics, machine learning (ML), and application development. The data will be in the target S3 bucket. The event and venue files are from the TICKIT dataset.
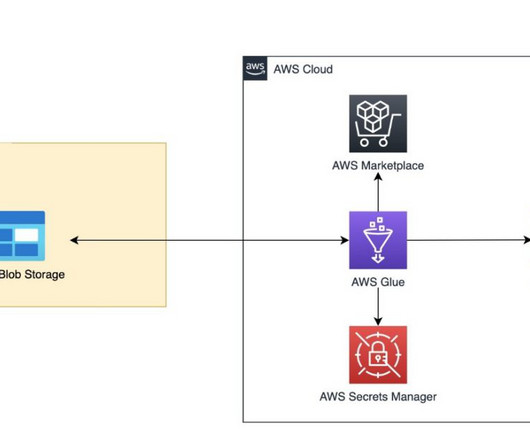
Regarding the Azure Data Lake Storage Gen2 Connector, we highlight any major differences in this post. AWS Glue is a serverless dataintegration service that makes it simple to discover, prepare, and combine data for analytics, machine learning, and application development. Learn more in README.
If that’s the case, then Atlas for Microsoft Dynamics just might be the Swiss army knife of Microsoft Dynamics data: Atlas solves dataintegration, operationalreporting, and data upload challenges all in one easy-to-use package. Not only that, it does so simply.
Having a live view of all aspects of their network lets them identify potentially faulty hardware in real time so they can avoid impact to customer call/data service. Ingest 100s of TB of network event data per day . Updates and deletes to ensure data correctness. All of the above, in one integrated and secured platform.
This post describes how HPE Aruba automated their Supply Chain management pipeline, and re-architected and deployed their data solution by adopting a modern data architecture on AWS. He has led a recent Big Data EAP (Enterprise Analytics Platform) build with one of the largest global SAP HANA/S4 implementations at HPE.
It has nothing to do with a lumpy mattress and everything to do with their financial reporting process. According to a recent survey of more than 900 CFOs and senior finance professionals across the globe, worrying about their organization’s reporting processes or deadlines is causing the vast majority of CFOs to lose some quality shut-eye.
AWS Glue is a serverless dataintegration service that makes it simple to discover, prepare, and combine data for analytics, machine learning, and application development. Conclusion In this post, we showed how to use AWS Glue and the new connector for ingesting data from Google Cloud Storage to Amazon S3.
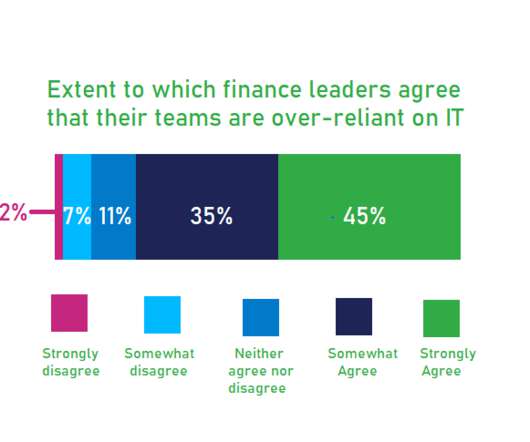
A recent survey by insightsoftware and Hanover Research reported 63% of IT decision makers find that finance is either very- or over-reliant on the IT department for operationalreporting. Both statistics are alarming considering market uncertainty increases the demand for more frequent, more accurate forecasts and reporting.
In Rita Sallam’s July 27 research, Augmented Analytics , she writes that “the rise of self-service visual-bases data discovery stimulated the first wave of transition from centrally provisioned traditional BI to decentralized data discovery.” We agree with that.
To fulfil these needs, you need direct access to accurate data from your ERP, and the ability to quickly create drillable Excel reports for GL and other finance requirements. To customize an existing report or to create a new one with Crystal Reports, you need technical expertise. But don’t just take our word for it.
While JD Edwards transactional data is required to run period close reports, analyze trends, and prepare forecasts for planning and budgeting, it comes with a lot of complexity. JD Edwards World has no less than 1600 tables of data to support just its business applications. Do you need to validate master data in your reporting?
By understanding and selecting the correct type of dashboard, organizations can maximize their influence, streamline efforts, and drive meaningful, sustained improvements in data quality. Data Quality Dimension-Focused Dashboards The first type of data quality dashboard emphasizes data quality dimensions.
that gathers data from many sources. These tools prep that data for analysis and then provide reporting on it from a central viewpoint. These reports are critical to making decisions. These systems are designed for people whose primary job is data analysis. Consider Delta. Delta has taken its app to the next level.
Finance teams are increasingly being asked for timely, recurring operationalreports to support day-to-day decision making. The most common challenges your finance team probably faces are: lengthy report creation time, existing tool complexity, and the inability to drill into transactional data. Limited access to data.
Your business needs actionable insights from your Oracle ERP data to respond to volatile market conditions and outpace your competition. But generating custom reports requires deep technical knowledge and the process is often managed by IT. The numbers show that finance professionals want more from their operationalreporting tools.
Operationalreporting is an effective, results-driven means of tracking, measuring, and analyzing your business’s regular deliverables and metrics. These dynamic reports offer invaluable insights into various logistical aspects relating to your organization’s activities across the board. Blind Spots and Data Silos.
Whether from your Oracle ERP Cloud or EBS (on-premises or implemented in a public or private cloud like Oracle Cloud Infrastructure or Azure), you must have the ability to efficiently transform that data into a format that works for your BI tools — for true, enterprise-wide reporting. Does This Challenge Sound Familiar? Download Now.
Not only does cloud migration allow businesses to adapt and scale with speed and efficiency, but it also provides better accessibility, lower costs than many on-prem solutions, better security, and improved integration options with other cloud-based applications. Today moving to the cloud is not an if, but a when.
Although Oracle E-Business Suite (EBS) provides a centralized hub for financial data, the manual process of exporting data into spreadsheets is both time-consuming and prone to errors, forcing finance teams to spend considerable time verifying numbers. How do you ensure greater efficiency and accuracy for your financial reports?
Organize and Clean the Data You Rely On. For many companies, SAP data can be a lighthouse in the storm, helping overloaded employees navigate strained supply chains. Your data from last week will probably apply cleanly next week, but it is likely to be polluted six months down the road.
As Business Intelligence (BI) tools, data warehousing solutions, and enterprise data and application landscapes have advanced, it’s worth taking the time to rethink that old model, starting with the dichotomy between operationalreporting (OR) and strategic analytics. Data Rich and Insight Poor. Download Now.
The beauty of enterprise resource planning (ERP) software is its ability to provide a central view of your organization’s financial, operational, and business data. They struggle with: Slow processes with long lead times due to a lack of pre-built financial content and heavy reliance on IT teams to create and modify reports.
Data mapping is essential for integration, migration, and transformation of different data sets; it allows you to improve your data quality by preventing duplications and redundancies in your data fields. Data mapping helps standardize, visualize, and understand data across different systems and applications.
Organizations continue to gravitate to the cloud for superior data access, process automation, centralized data security, and reduced IT dependency. About 27% of organizations have fully moved to a cloud environment, while 62% operate in a hybrid setting that balances on-premises systems with cloud applications.
Finance is now tasked with providing timely planning, forecasting, and reporting that informs business decisions in the moment. Data limitations and inaccuracies (33 percent). Changing reporting criteria (35 percent). Why are you hiring trained financial professionals to crunch data? How to Minimize IT Dependence.
Modern data infrastructure demands tools that scale effortlessly to handle growing volumes and complexity. Its distributed architecture empowers organizations to query massive datasets across databases, data lakes, and cloud platforms with speed and reliability. The Simba Story: Advancing Leadership in Data Connectivity Download Now 4.
Working in restrictive conditions is tough, especially when your reporting software doesn’t do enough to limit those restraints. Finance teams are regularly tasked with creating operationalreports for their own use or to share with other business areas (departmental expenditure, open invoices, performance against budget).
Working in restrictive conditions is tough, especially when your reporting software doesn’t do enough to limit those restraints. Finance teams are regularly tasked with creating operationalreports for their own use or to share with other business areas (departmental expenditure, open invoices, performance against budget).
Change Data : A method of tracking and capturing changes made to data in a database or data source, including monitoring inserts, updates, and deletes to data records in real-time or near-real-time for the purpose of keeping downstream systems, such as data warehouses, data lakes, or other applications, in sync with the source data systems.
Inconsistent Data Drags Your Decision-Making Down With cloud migration and digital transformation fueling the drive for optimized supply chains, any lingering data management struggles become glaring bottlenecks. Many operationalreporting teams remain buried under static PDF reports or rigid native ERP functionalities.
Finance teams who struggle to meet the demand for recurring operationalreports are increasingly adopting Oracle ERP Cloud for ease of access to real-time data. Why are nearly 90% of teams unhappy with their operationalreporting tools ? Reporting is slow. Building custom reports takes time.
The move to the cloud continues at a fast pace and if your organization embraces the future of operationalreporting, then you need a plan to ensure consistent enterprise-wide reporting during your cloud journey. A report with multiple columns from a single View may draw data from many different tables.
When extracting your financial and operationalreportingdata from a cloud ERP, your enterprise organization needs accurate, cost-efficient, user-friendly insights into that data. While real-time extraction is historically faster, your team needs the reliability of the replication process for your cloud data extraction.
Unable to collaborate effectively, your team will struggle to promptly respond to leadership needs and custom data queries required to navigate your business through troubled waters. Limited data accessibility: Restricted data access obstructs comprehensive reporting and limits visibility into business processes.
Board reports help keep different branches of your company informed about what others are doing in order to facilitate decision-making. These reports also provide readers with guidance as to where the company sits at present, and where the executive sees it heading in the future and via which strategies. progress reviews.
For decades, hundreds of enterprise Oracle ERP customers have taken advantage of the industry-leading capabilities for operationalreporting and strategic analytics offered by Angles for Oracle (formerly Noetix.) Centralized Management of On-premises and Cloud Reports and Analytics. Version 22.1 Cross-functional collaboration.
Inventory KPIs and metrics are crucial aspects of the reporting process. Inventory KPIs provide businesses with accurate information to make data-driven decisions. Metrics help give management the full picture of operations they need to make impactful decisions. #2. Product sales are a vital part of reporting.
The Paycheck Protection Program, for example, required a detailed analysis of payroll expenses; but it also called upon businesses to back out the salaries of certain high-earners from those reports. Agile reporting was the key to successfully getting through the pandemic, especially in those early weeks and months.
Offering purpose-built software that deeply integrates with Oracle E-Business Suite in Excel, Wands gives you quick access to the real-time data you need, when you need it, without relying on IT or resorting to manual data dumps. What was the biggest challenge for these CFOs in creating useful and effective ESG reporting?
We organize all of the trending information in your field so you don't have to. Join 42,000+ users and stay up to date on the latest articles your peers are reading.
You know about us, now we want to get to know you!
Let's personalize your content
Let's get even more personalized
We recognize your account from another site in our network, please click 'Send Email' below to continue with verifying your account and setting a password.


Let's personalize your content