This site uses cookies to improve your experience. To help us insure we adhere to various privacy regulations, please select your country/region of residence. If you do not select a country, we will assume you are from the United States. Select your Cookie Settings or view our Privacy Policy and Terms of Use.
Cookie Settings
Cookies and similar technologies are used on this website for proper function of the website, for tracking performance analytics and for marketing purposes. We and some of our third-party providers may use cookie data for various purposes. Please review the cookie settings below and choose your preference.
Used for the proper function of the website
Used for monitoring website traffic and interactions
Cookie Settings
Cookies and similar technologies are used on this website for proper function of the website, for tracking performance analytics and for marketing purposes. We and some of our third-party providers may use cookie data for various purposes. Please review the cookie settings below and choose your preference.
Strictly Necessary: Used for the proper function of the website
Performance/Analytics: Used for monitoring website traffic and interactions
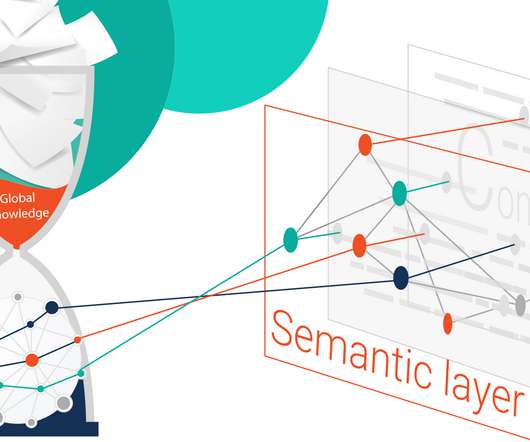
The key to success is to start enhancing and augmenting content management systems (CMS) with additional features: semantic content and context. TAM management, like content management, begins with business strategy. My favorite approach to TAM creation and to modern datamanagement in general is AI and machine learning (ML).
The Semantic Web, both as a research field and a technology stack, is seeing mainstream industry interest, especially with the knowledge graph concept emerging as a pillar for data well and efficiently managed. And what are the commercial implications of semantic technologies for enterprise data?
Paradoxically, even without a shared definition and common methodology, the knowledge graph (and its discourse) has steadily settled in the discussion about datamanagement, dataintegration and enterprise digital transformation. Maximize the usability of your data.
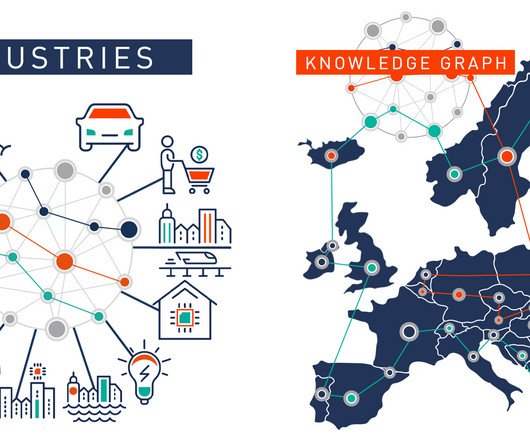
It can apply automated reasoning to extract further knowledge and make new connections between different pieces of data. This model is used in various industries to enable seamless dataintegration, unification, analysis and sharing. Manufacturing and Industry 4.0 The possibilities are endless!
In daily work, when business develops to a relatively large scale, we will all face variable management problems. Among these problems, one is that the third party on market data analysis platform or enterprises’ own platforms have been unable to meet the needs of business development. Data Analysis. Data Visualization.
This has enabled them to meet the requirements coming from heterogeneous data in building automation systems, the interoperability issues critical for design engineering and, last but not least, the challenges in air-traffic control. The framework addresses current dataintegration needs and prepares for future capability.
Added to this is the increasing demands being made on our data from event-driven and real-time requirements, the rise of business-led use and understanding of data, and the move toward automation of dataintegration, data and service-level management. 10 Steps toward a Data Fabric with Knowledge Graphs.
It enriched their understanding of the full spectrum of knowledge graph business applications and the technology partner ecosystem needed to turn data into a competitive advantage. Content and datamanagement solutions based on knowledge graphs are becoming increasingly important across enterprises.
Poor datamanagement, data silos, and a lack of a common understanding across systems and/or teams are the root cause that prohibits an organization from scaling the business in a dynamic environment. Beyond that, and without a way to visualize, connect, and utilize the data, it’s still just a bunch of random information.
As 2019 comes to an end, we at Ontotext are taking stock of the most fascinating things we have done to empower knowledgemanagement and knowledgediscovery this year. In 2019, Ontotext open-sourced the front-end and engine plugins of GraphDB to make the development and operation of knowledge graphs easier and richer.
Graphs boost knowledgediscovery and efficient data-driven analytics to understand a company’s relationship with customers and personalize marketing, products, and services. As such, most large financial organizations have moved their data to a data lake or a data warehouse to understand and manage financial risk in one place.
Semantic DataIntegration With GraphDB. In the context of the FROCKG project, we have loaded close to one billion triples in the knowledge graph and, if you want to explore it, you can easily write a SPARQL query that can create a sub-graph. The screenshot below shows the clinical trials ontology used for this project.
Knowledge graphs, while not as well-known as other datamanagement offerings, are a proven dynamic and scalable solution for addressing enterprise datamanagement requirements across several verticals. The use of globally unique identifiers facilitates dataintegration and publishing.
Capturing data, converting it into the right insights, and integrating those insights quickly and efficiently into business decisions and processes is generating a significant competitive advantage for those who do it right. dataintegration, digitalization, enterprise search, lineage traceability, cybersecurity, access control).
We organize all of the trending information in your field so you don't have to. Join 42,000+ users and stay up to date on the latest articles your peers are reading.
You know about us, now we want to get to know you!
Let's personalize your content
Let's get even more personalized
We recognize your account from another site in our network, please click 'Send Email' below to continue with verifying your account and setting a password.
Let's personalize your content