This site uses cookies to improve your experience. To help us insure we adhere to various privacy regulations, please select your country/region of residence. If you do not select a country, we will assume you are from the United States. Select your Cookie Settings or view our Privacy Policy and Terms of Use.
Cookie Settings
Cookies and similar technologies are used on this website for proper function of the website, for tracking performance analytics and for marketing purposes. We and some of our third-party providers may use cookie data for various purposes. Please review the cookie settings below and choose your preference.
Used for the proper function of the website
Used for monitoring website traffic and interactions
Cookie Settings
Cookies and similar technologies are used on this website for proper function of the website, for tracking performance analytics and for marketing purposes. We and some of our third-party providers may use cookie data for various purposes. Please review the cookie settings below and choose your preference.
Strictly Necessary: Used for the proper function of the website
Performance/Analytics: Used for monitoring website traffic and interactions
New drivers simplify Workday dataintegration for enhanced analytics and reporting RALEIGH, N.C. – The Simba Workday drivers provide secure access to Workday data for analytics, ETL (extract, transform, load) processes, and custom application development using both ODBC and JDBC technologies.
insightsoftware, the leading provider of solutions for the Office of the CFO, is thrilled to introduce our new cloud connector for Infor M3 ERPs and Spreadsheet Server , our Excel-based reporting solution. With our cloud connector your team can work in an uninterrupted reporting environment before, during, and after your cloud migration.
Businesses that rely on SAP reporting to track their key performance indicators also typically rely on their IT department to facilitate initial report creation. Creating reports inside the SAP ecosystem involves the careful collection and integration of data in ways that only IT knows how to connect.
BI system migration Regulatory compliance Changes and Impact analysis Fixing reports. Dive Deeper into How Advanced Lineage Can Improve Your Hybrid BI Environment Check out our webinar for more tips and insights Watch the Webinar. Migrating Data to the Cloud. Conducting Root Cause Analysis to Fix Reports .
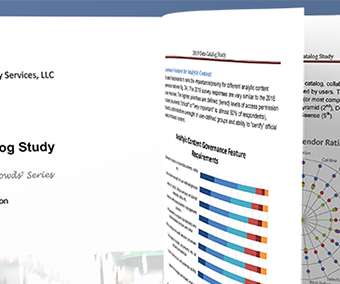
So what’s holding organizations back from fully using their data to make better, smarter business decisions? Data Governance Bottlenecks. The report revealed that all but two of the possible bottlenecks were marked by more than 50 percent of respondents. The What & Why of Data Governance ” webinar on Tuesday, Feb.
To fulfil these needs, you need direct access to accurate data from your ERP, and the ability to quickly create drillable Excel reports for GL and other finance requirements. To customize an existing report or to create a new one with Crystal Reports, you need technical expertise. But don’t just take our word for it.
When data modelers can take advantage of intuitive graphical interfaces, they’ll have an easier time viewing data from anywhere in context or meaning and relationships support of artifact reuse for large-scale dataintegration, master data management, big data and business intelligence/analytics initiatives.
Phillip Russom is the director of TDWI (Transforming Data With Intelligence) Research for data management and he oversees many services, events and research-centered publications. We have had the pleasure of partnering with him for webinars and he always brings a new perspective and interesting insights.
If you’ve used Google, you’ve used the cornucopia of Linked data across the Web, through Google’s Knowledge Graph (Google’s Knowledge Graph is reportedly supported by Freebase – the knowledge acquired by Google in 2010. ) We rather see it as a new paradigm that is revolutionizing enterprise dataintegration and knowledge discovery.
All-in-one tax solution now streamlines Pillar Two reporting and compliance to enhance overall financial planning Standalone option available for companies seeking Pillar Two support within their existing tax solution RALEIGH, N.C. – – Tim Poole, Director, Global Tax Reporting and Regulation at IHG Hotels & Resorts BEPS 2.0
Flexibility is an absolute must for your planning solution to support a Sales Compensation Model, as well as extensive analytic and reporting capabilities. Let’s dive deeper: Dataintegration. Commission Analysts spend lot of time in ensuring that the incoming data is consistent and accurate.
There seem to be as many data governance vendors as there are data governance definitions! But by reviewing the offerings of the leading 18 vendors, Forrester Research’s new report, The Data Governance Solutions Landscape, Q4 2022 , can help you narrow your options based on core and extended features, size, and industry focus.
Ad hoc exploration and scheduled reports. What is Real Time Data Warehousing? The simplest way to describe a RTDW is that it looks and feels like a normal data warehouse, but everything is faster even while massive scale is maintained. a data mart) or more comprehensively as an Enterprise Data Warehouse.
Why budgeting feels like a marathon Just like marathon training takes months of preparation, crafting a budget involves a lot of data collection, metrics analysis, resource allocation and collaboration. This data helps us understand earlier trends and is vital for making a realistic budget.
On Thursday January 6th I hosted Gartner’s 2022 Leadership Vision for Data and Analytics webinar. There were 80 or so questions or comments posted and I was not able to respond to all of them live in the webinar so here are the verbatim questions and an individual response to each on. I hope they are helpful.
And, Dresner found that the largest organizations (more than 10,000 employees) struggle the most with finding relevant data. The study concludes that larger organizations have greater complexity and requirements for dataintegration, cataloging, and governance. Agile Stewardship: Alation’s scalable approach to governance.
In her role, she hosts webinars, gives lectures, publishes articles, and provides thought leadership on all subjects related to taxation and modern accounting. That means complying with standards of the profession as well as national and international regulations around data security. Download Now.
It demonstrates how GraphDB and metaphactory work together and how you can employ the platform’s intuitive and out-of-the-box search, visualization and authoring components to empower end users to consume data from your knowledge graph. You can also listen to our on-demand webinar on the same topic or check out our use case brief.
In a practical sense, a modern data catalog should capture a broad array of metadata that also serves a broader array of consumers. In concrete terms, that includes metadata for a broad array of asset classes, such as BI reports, business metrics, business terms, domains, functional business processes, and more. Simply put?
They range from automating repeatable processes to improved analytics and reporting, to better integration with other organizational functions. The tools for delving deep into the data of the business, identifying patterns, and making predictions on trends are making a real impact.
However, it offers two extremely valuable business benefits: reducing data redundancy and improving dataintegrity. In short, it helps to keep the data effective, a highly desirable feature of any database. Figure 11: Data normalization. So a report to look for that can find all such issues in the blink of an eye.
How do you ensure greater efficiency and accuracy for your financial reports? Here are five ways you can improve finance reporting efficiency, backed by our recent research into Oracle-driven finance teams. Embrace Finance Automation Oracle-driven finance teams contend with a wide range of automated financial reporting needs.
But many companies fail to achieve this goal because they struggle to provide the reporting and analytics users have come to expect. that gathers data from many sources. These tools prep that data for analysis and then provide reporting on it from a central viewpoint. These reports are critical to making decisions.
Watch Now: Tax reporting in a changing world. We asked webinar attendees to report how their tax department is viewed by other coworkers. Agile reporting was the key to successfully getting through the pandemic, especially in those early weeks and months. This analysis was critically important for most organizations.
A large US-headquartered multinational manufacturer with sales in 100 countries wanted to manage operational transfer pricing at year-end with more accuracy and transparency, and to move toward a position where it could analyze the meaning behind its reported numbers in more detail. Managing DataIntegrity. User Acceptance.
You have multiple options for reporting and analysis available to you from Microsoft. But if your business is growing, you are probably looking to push beyond the out-of-the-box capabilities to develop your own custom analysis and meaningful data insights. Easy, Excel-Based Reporting Built for Microsoft D365 F&SCM.
By automating and integrating your reporting processes, you can eliminate vast amounts of manual effort and relieve your team of the overload that is often associated with year-end processes. For most companies, year-end reporting requires the addition of narrative content to add context and meaning in the form of explanatory notes.
While it generates canned reports, custom reports still require the help of IT departments and outside consultants. For your accounting and finance team especially, this challenge makes it difficult to create the critical financial reports that drive your business. Refreshable NetSuite Reports for Real-Time Insights.
Given your organizations focus on productivity, you know soon your team will working in a divided reporting environment. While the cloud infrastructure promises to bring positive changes, your company’s data will exist in both worlds: on-prem and the cloud.
Recently, insightsoftware broke this all down in a webinar created and led by Richard den Ouden, the co-founder of Angles of SAP. The on-demand webinar is available here. Watch this webinar and learn how to: Measure OTIF in different ways (requested, first confirmed, last confirmed date). Interested in Financial Reporting.
According to a recent Gartner report, a staggering 61% of finance organizations haven’t yet adopted AI. Thorough data preparation and control act as the foundation, allowing finance teams to leverage the full power of Oracle’s AI and transform their financial operations, now or in the future.
insightsoftware recently hosted a webinar on the topic of “ The Office of the CFO – A New Era: Decision Making at the Speed of Light ”. It’s really important for us to get our close done in a timely manner, allowing us to do more analysis than just the day-to-day journal entries and building reports,” said Donahue.
Your finance team is under pressure to make data-driven decisions that optimize financial health and fuel strategic growth. But a hidden roadblock can impede your progress: report generation. This reliance on IT for reports can lead to delays and frustration, hindering your team’s ability to be agile and responsive.
When extracting your financial and operational reportingdata from a cloud ERP, your enterprise organization needs accurate, cost-efficient, user-friendly insights into that data. While real-time extraction is historically faster, your team needs the reliability of the replication process for your cloud data extraction.
How do we create a data warehouse or data lake in the cloud using our cloud ERP? How do I access the legacy data from my previous ERP? How can we rapidly build BI reports on cloud ERP data without any help from IT? Business teams can struggle to move data to/from these applications and must lean on IT for help.
However, the modern business landscape demands a more efficient and integrated approach to ensure accurate and timely financial disclosures. In today’s fast-paced environment, manual data consolidation from various sources (ERP systems, spreadsheets) into cohesive reports within Excel can be time-consuming and prone to errors.
Defining Self-Service BI Gartner defines self-service BI as “end users designing and deploying their own reports and analyses within an approved and supported architecture and tools portfolio”. Therefore, analysis, dynamic reports, and dashboards are sufficient to cover their self-service BI needs in most cases.
Tangibly, this means more planning, more accurate and deeper forecasting, and more strategic decision-making based on real-time reporting. System-driven reports can often be inconsistent across those various software packages, and no single system can provide a complete picture of the business. Interested in Financial Reporting.
Interestingly, these internal-facing objectives all relate to accessibility of data. The most popular objectives include “improved self-service,” “broaden access to internal users,” and “enhance access to existing reports/analyses.”. If you want data-literate users, you need analytics.
When the time comes for month-end reporting, ERPs like Yardi manage and compartmentalize data with out of the box reports. Yardi, along with most ERPs, comes with native reporting tools. Pitfalls of Native ERP Reporting. of respondents outsource reports. Yardi Overview. Access Resource. Analysis is Key.
Watch our on-demand webinar “ What Are The Forecasting Best Practices Of Transformation Leaders?” Focusing on the things that matter week to week, with the right stakeholders and with an eye to the future, enables an agile and confident response. The proof of the pudding is in the tasting! Schauer says his weekly forecasts are 98% accurate.
Gone are the days of relying on your overtaxed IT department for the reports that fuel your business. Jet acts as the perfect conduit between your ERP data and Power BI. This enables finance teams to create and manage insightful custom reports in the front-end visualization tool their executives know and love. Access Resource.
Their ERP is not connected to planning and budgeting, and many routinely struggle with reporting and analytics. Off-the-shelf reporting in most ERP systems is either difficult to use, functionally limited, or both. insightsoftware’s Connect Effect isn’t just about reporting, though. Global Collaboration.
It’s best to present them with everything they need from the get-go, like: Real-time Data. Self-Reporting. Advanced Reporting. Take your data analysis to a whole new level with embedded analytics. As soon as you start leveling up your analytics, your end-users and clients will want more. Dashboards. Automation.
We organize all of the trending information in your field so you don't have to. Join 42,000+ users and stay up to date on the latest articles your peers are reading.
You know about us, now we want to get to know you!
Let's personalize your content
Let's get even more personalized
We recognize your account from another site in our network, please click 'Send Email' below to continue with verifying your account and setting a password.


Let's personalize your content