This site uses cookies to improve your experience. To help us insure we adhere to various privacy regulations, please select your country/region of residence. If you do not select a country, we will assume you are from the United States. Select your Cookie Settings or view our Privacy Policy and Terms of Use.
Cookie Settings
Cookies and similar technologies are used on this website for proper function of the website, for tracking performance analytics and for marketing purposes. We and some of our third-party providers may use cookie data for various purposes. Please review the cookie settings below and choose your preference.
Used for the proper function of the website
Used for monitoring website traffic and interactions
Cookie Settings
Cookies and similar technologies are used on this website for proper function of the website, for tracking performance analytics and for marketing purposes. We and some of our third-party providers may use cookie data for various purposes. Please review the cookie settings below and choose your preference.
Strictly Necessary: Used for the proper function of the website
Performance/Analytics: Used for monitoring website traffic and interactions
Amazon DataZone now launched authentication supports through the Amazon Athena JDBC driver, allowing data users to seamlessly query their subscribed datalake assets via popular business intelligence (BI) and analytics tools like Tableau, Power BI, Excel, SQL Workbench, DBeaver, and more.
Since the deluge of big data over a decade ago, many organizations have learned to build applications to process and analyze petabytes of data. Datalakes have served as a central repository to store structured and unstructured data at any scale and in various formats.
Organizations are collecting and storing vast amounts of structured and unstructured data like reports, whitepapers, and research documents. By consolidating this information, analysts can discover and integrate data from across the organization, creating valuable data products based on a unified dataset.
However, enterprises often encounter challenges with data silos, insufficient access controls, poor governance, and quality issues. Embracing data as a product is the key to address these challenges and foster a data-driven culture. Amazon Athena is used to query, and explore the data.
In the following section, two use cases demonstrate how the data mesh is established with Amazon DataZone to better facilitate machine learning for an IoT-based digital twin and BI dashboards and reporting using Tableau. datazone_env_twinsimsilverdata"."cycle_end";') This led to a complex and slow computations.
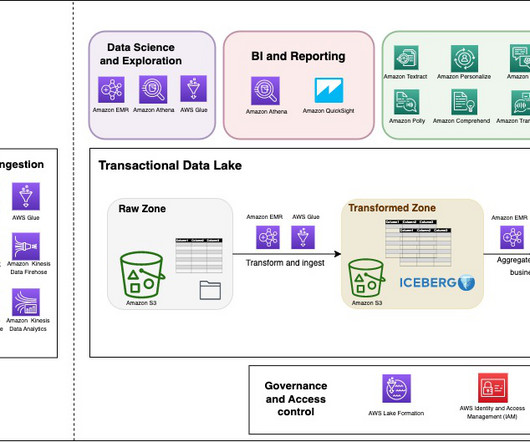
With data becoming the driving force behind many industries today, having a modern data architecture is pivotal for organizations to be successful. In this post, we describe Orca’s journey building a transactional datalake using Amazon Simple Storage Service (Amazon S3), Apache Iceberg, and AWS Analytics.
Corporate ESG reporting is getting real for companies around the globe. Enacted and proposed regulations in the EU, US, and beyond are deepening reporting requirements in an effort to change business behavior. The foundation for ESG reporting, of course, is data. The foundation for ESG reporting, of course, is data.
A data management platform (DMP) is a group of tools designed to help organizations collect and manage data from a wide array of sources and to create reports that help explain what is happening in those data streams. Deploying a DMP can be a great way for companies to navigate a business world dominated by data.
It’s necessary to say that these processes are recurrent and require continuous evolution of reports, online data visualization , dashboards, and new functionalities to adapt current processes and develop new ones. Discover the available data sources. Collaboratively develop reports. Construction Iterations.
Since its launch in 2006, Amazon Simple Storage Service (Amazon S3) has experienced major growth, supporting multiple use cases such as hosting websites, creating datalakes, serving as object storage for consumer applications, storing logs, and archiving data. Enable the Cost and Usage Reports.
In particular, companies that were leaders at using data and analytics had three times higher improvement in revenues, were nearly three times more likely to report shorter times to market for new products and services, and were over twice as likely to report improvement in customer satisfaction, profits, and operational efficiency.
The data products used inside the company include insights from user journeys, operational reports, and marketing campaign results, among others. The data platform serves on average 60 thousand queries per day. The data volume is in double-digit TBs with steady growth as business and data sources evolve.
One crucial business requirement for the ecommerce company is to generate a Pricing Summary Report that provides a detailed analysis of pricing and discounting strategies. This report is essential for understanding revenue streams, identifying opportunities for optimization, and making data-driven decisions regarding pricing and promotions.
Data management platform definition A data management platform (DMP) is a suite of tools that helps organizations to collect and manage data from a wide array of first-, second-, and third-party sources and to create reports and build customer profiles as part of targeted personalization campaigns.
With AWS Glue, you can discover and connect to hundreds of diverse data sources and manage your data in a centralized data catalog. It enables you to visually create, run, and monitor extract, transform, and load (ETL) pipelines to load data into your datalakes. Choose Store a new secret.
Each data producer within the organization has its own datalake in Apache Hudi format, ensuring data sovereignty and autonomy. These datasets are pivotal for reporting and analytics use cases, powered by services like Amazon Redshift and tools like Power BI.
The technological linchpin of its digital transformation has been its Enterprise Data Architecture & Governance platform. It hosts over 150 big data analytics sandboxes across the region with over 200 users utilizing the sandbox for data discovery.
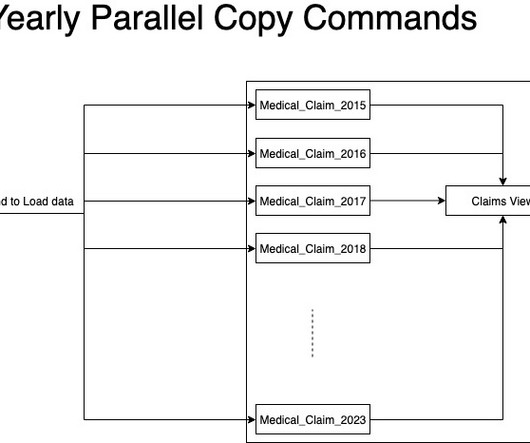
They recently needed to do a monthly load of 140 TB of uncompressed healthcare claims data in under 24 hours after receiving it to provide analysts and data scientists with up-to-date information on a patient’s healthcare journey. This data volume is expected to increase monthly and is fully refreshed each month.
The Solution: CDP Private Cloud brings a next-generation hybrid architecture with cloud-native benefits to HBL’s data platform. HBL started their data journey in 2019 when datalake initiative was started to consolidate complex data sources and enable the bank to use single version of truth for decision making.
Its digital transformation began with an application modernization phase, in which Dickson and her IT teams determined which applications should be hosted in the public cloud and which should remain on a private cloud. Energy optimization is another key aspect of DS Smith’s data and sustainability pipeline, the CIO says.
QuickSight makes it straightforward for business users to visualize data in interactive dashboards and reports. You can slice data by different dimensions like job name, see anomalies, and share reports securely across your organization. QuickSight lets you perform aggregate calculations on metrics for deeper analysis.
For the past 5 years, BMS has used a custom framework called Enterprise DataLake Services (EDLS) to create ETL jobs for business users. BMS’s EDLS platform hosts over 5,000 jobs and is growing at 15% YoY (year over year). About the authors Sivaprasad Mahamkali is a Senior Streaming Data Engineer at AWS Professional Services.
Amazon Redshift , a warehousing service, offers a variety of options for ingesting data from diverse sources into its high-performance, scalable environment. This native feature of Amazon Redshift uses massive parallel processing (MPP) to load objects directly from data sources into Redshift tables.
Many organizations are building datalakes to store and analyze large volumes of structured, semi-structured, and unstructured data. In addition, many teams are moving towards a data mesh architecture, which requires them to expose their data sets as easily consumable data products.
Does your organization’s success depend on immediate delivery of new reports, applications, or projects? Cloudera’s Data Warehouse service allows raw data to be stored in the cloud storage of your choice (S3, ADLSg2). When your IT admin registers an environment in CDP, a DataLake is automatically deployed.
Amazon Redshift is a fast, scalable, and fully managed cloud data warehouse that allows you to process and run your complex SQL analytics workloads on structured and semi-structured data. It also helps you securely access your data in operational databases, datalakes, or third-party datasets with minimal movement or copying of data.
The CIO of a regulatory agency that reports to the US Securities and Exchange Commission — one of the biggest cloud consumers in the world — has made it his mission to help other CIOs — and Amazon Web Services itself — improve cloud computing.
The challenge is to do it right, and a crucial way to achieve it is with decisions based on data and analysis that drive measurable business results. This was the key learning from the Sisense event heralding the launch of Periscope Data in Tel Aviv, Israel — the beating heart of the startup nation. What VCs want from startups.
This includes the expected response time limits for dashboard queries or analytical queries, elapsed runtime for daily ETL jobs, desired elapsed time for data sharing with consumers, total number of tenants with concurrency of loads and reports, and mission-critical reports for executives or factory operations.
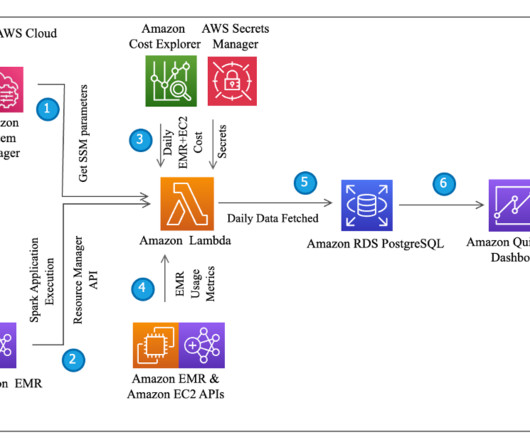
The data stored in the RDS tables is then queried to derive chargeback figures and generate reporting trends using Amazon QuickSight. These components are used to summarize the resource consumption and cost in the final report. You can use the SQL query to create a report dashboard to plot multiple charts for the insights.
Well firstly, if the main data warehouses, repositories, or application databases that BusinessObjects accesses are on premise, it makes no sense to move BusinessObjects to the cloud until you move its data sources to the cloud. You also have the option of hosting with a third party.
Without C360, businesses face missed opportunities, inaccurate reports, and disjointed customer experiences, leading to customer churn. Pillar 3: Analytics The analytics pillar defines capabilities that help you generate insights on top of your customer data. Organizations using C360 achieved 43.9% faster time to market, and 19.1%
For example, if a cloud vendor hosts a datalake that requires operational technology data to synchronize and feed back into a decision algorithm on the production line, we measure latency. In this quarter, 74% of large enterprises report having FinOps teams and processes in place, up from 61% in 2022,” he says.
Start where your data is Using your own enterprise data is the major differentiator from open access gen AI chat tools, so it makes sense to start with the provider already hosting your enterprise data. Data privacy, data control, and data access management has changed massively even over the last five years,” he says. “A
At these times, they run business growth reports, shareholder reports, and financial reports for their earnings calls, to name a few examples. For example, the bank from our example might have separate destination datalakes for their perpetual and periodic workloads to support addressing these VIP workloads separately.
2020 saw us hosting our first ever fully digital Data Impact Awards ceremony, and it certainly was one of the highlights of our year. We saw a record number of entries and incredible examples of how customers were using Cloudera’s platform and services to unlock the power of data. DATA FOR GOOD.
All descriptive statistics can be calculated using quantitative data. It’s analyzed through numerical comparisons and statistical inferences and is reported through statistical analyses. Despite its many uses, quantitative data presents two main challenges for a data-driven organization.
The workflow contains the following steps: Data is saved by the producer in their own Amazon Simple Storage Service (Amazon S3) buckets. Data source locations hosted by the producer are created within the producer’s AWS Glue Data Catalog. Data source locations are registered with Lake Formation.
Those decentralization efforts appeared under different monikers through time, e.g., data marts versus data warehousing implementations (a popular architectural debate in the era of structured data) then enterprise-wide datalakes versus smaller, typically BU-Specific, “data ponds”.
The warehouse being hosted in the cloud makes it more accessible, and with a rise in cloud SaaS products, integrating a company’s myriad cloud apps (Salesforce, Marketo, etc.) with a cloud data warehouse is simple. Cloud data warehouses in your data stack.
The Corner Office is pressing their direct reports across the company to “Move To The Cloud” to increase agility and reduce costs. There are now tens of thousands of instances of these Big Data platforms running in production around the world today, and the number is increasing every year.
Not that I’m implying anything about current economic conditions vis-a-vis the timing of this report… #justsayin. Fun fact : I co-founded an e-commerce company (realistically, a mail-order catalog hosted online) in December 1992 using one of those internetworking applications called Gopher , which was vaguely popular at the time.
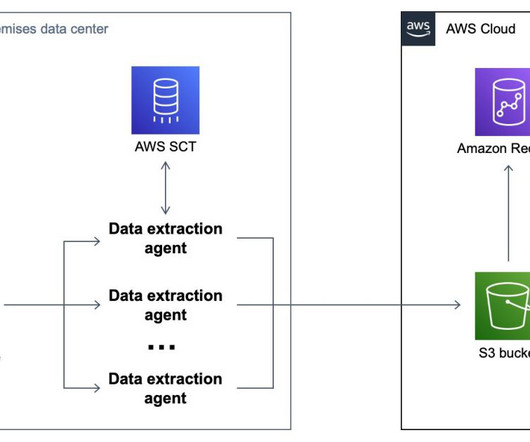
Tens of thousands of customers use Amazon Redshift to gain business insights from their data. With Amazon Redshift, you can use standard SQL to query data across your data warehouse, operational data stores, and datalake. After you install the data extraction agent, register it in AWS SCT.
In today’s world, data warehouses are a critical component of any organization’s technology ecosystem. They provide the backbone for a range of use cases such as business intelligence (BI) reporting, dashboarding, and machine-learning (ML)-based predictive analytics, that enable faster decision making and insights.
We organize all of the trending information in your field so you don't have to. Join 42,000+ users and stay up to date on the latest articles your peers are reading.
You know about us, now we want to get to know you!
Let's personalize your content
Let's get even more personalized
We recognize your account from another site in our network, please click 'Send Email' below to continue with verifying your account and setting a password.


Let's personalize your content