This site uses cookies to improve your experience. To help us insure we adhere to various privacy regulations, please select your country/region of residence. If you do not select a country, we will assume you are from the United States. Select your Cookie Settings or view our Privacy Policy and Terms of Use.
Cookie Settings
Cookies and similar technologies are used on this website for proper function of the website, for tracking performance analytics and for marketing purposes. We and some of our third-party providers may use cookie data for various purposes. Please review the cookie settings below and choose your preference.
Used for the proper function of the website
Used for monitoring website traffic and interactions
Cookie Settings
Cookies and similar technologies are used on this website for proper function of the website, for tracking performance analytics and for marketing purposes. We and some of our third-party providers may use cookie data for various purposes. Please review the cookie settings below and choose your preference.
Strictly Necessary: Used for the proper function of the website
Performance/Analytics: Used for monitoring website traffic and interactions
Amazon Redshift , launched in 2013, has undergone significant evolution since its inception, allowing customers to expand the horizons of data warehousing and SQL analytics. Industry-leading price-performance Amazon Redshift offers up to three times better price-performance than alternative cloud datawarehouses.
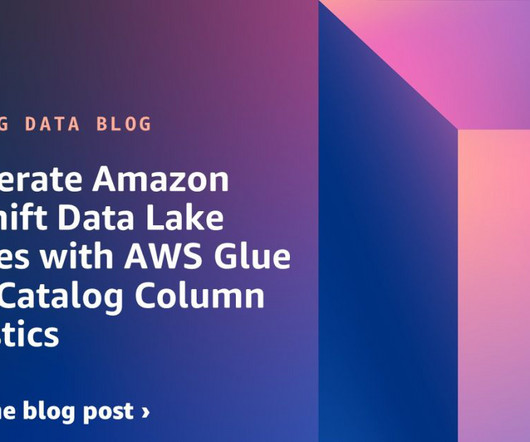
Amazon Redshift enables you to efficiently query and retrieve structured and semi-structured data from open format files in Amazon S3 datalake without having to load the data into Amazon Redshift tables. Amazon Redshift extends SQL capabilities to your datalake, enabling you to run analytical queries.
With this new functionality, customers can create up-to-date replicas of their data from applications such as Salesforce, ServiceNow, and Zendesk in an Amazon SageMaker Lakehouse and Amazon Redshift. SageMaker Lakehouse gives you the flexibility to access and query your data in-place with all Apache Iceberg compatible tools and engines.
A modern data architecture enables companies to ingest virtually any type of data through automated pipelines into a datalake, which provides highly durable and cost-effective object storage at petabyte or exabyte scale.
Amazon Redshift is a fast, fully managed petabyte-scale cloud datawarehouse that makes it simple and cost-effective to analyze all your data using standard SQL and your existing business intelligence (BI) tools. Amazon Redshift also supports querying nested data with complex data types such as struct, array, and map.
licensed, 100% open-source data table format that helps simplify data processing on large datasets stored in datalakes. Data engineers use Apache Iceberg because it’s fast, efficient, and reliable at any scale and keeps records of how datasets change over time.
A modern data architecture is an evolutionary architecture pattern designed to integrate a datalake, datawarehouse, and purpose-built stores with a unified governance model. Of those tables, some are larger (such as in terms of record volume) than others, and some are updated more frequently than others.
Analytics remained one of the key focus areas this year, with significant updates and innovations aimed at helping businesses harness their data more efficiently and accelerate insights. From enhancing datalakes to empowering AI-driven analytics, AWS unveiled new tools and services that are set to shape the future of data and analytics.
This book is not available until January 2022, but considering all the hype around the data mesh, we expect it to be a best seller. In the book, author Zhamak Dehghani reveals that, despite the time, money, and effort poured into them, datawarehouses and datalakes fail when applied at the scale and speed of today’s organizations.
Enterprise data is brought into datalakes and datawarehouses to carry out analytical, reporting, and data science use cases using AWS analytical services like Amazon Athena , Amazon Redshift , Amazon EMR , and so on. Outside of his work, Naidu practices yoga and goes trekking often.
A point of data entry in a given pipeline. Examples of an origin include storage systems like datalakes, datawarehouses and data sources that include IoT devices, transaction processing applications, APIs or social media. The final point to which the data has to be eventually transferred is a destination.
In 2013, Amazon Web Services revolutionized the data warehousing industry by launching Amazon Redshift , the first fully-managed, petabyte-scale, enterprise-grade cloud datawarehouse. Amazon Redshift made it simple and cost-effective to efficiently analyze large volumes of data using existing business intelligence tools.
In these instances, data feeds come largely from various advertising channels, and the reports they generate are designed to help marketers spend wisely. All this data arrives by the terabyte, and a data management platform can help marketers make sense of it all. SAS Data Management. Of course, marketing also works.
Data architect Armando Vázquez identifies eight common types of data architects: Enterprise data architect: These data architects oversee an organization’s overall data architecture, defining data architecture strategy and designing and implementing architectures. Are data architects in demand?
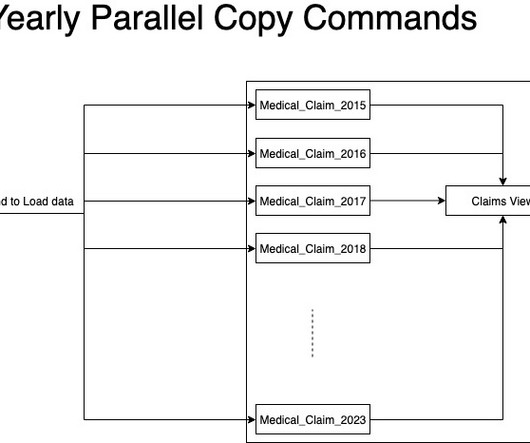
These processes retrieve data from around 90 different data sources, resulting in updating roughly 2,000 tables in the datawarehouse and 3,000 external tables in Parquet format, accessed through Amazon Redshift Spectrum and a datalake on Amazon Simple Storage Service (Amazon S3). We started with 115 dc2.large
Because Gilead is expanding into biologics and large molecule therapies, and has an ambitious goal of launching 10 innovative therapies by 2030, there is heavy emphasis on using data with AI and machine learning (ML) to accelerate the drug discovery pipeline. Loading data is a key process for any analytical system, including Amazon Redshift.
The current scaling approach of Amazon Redshift Serverless increases your compute capacity based on the query queue time and scales down when the queuing reduces on the datawarehouse. This post also includes example SQLs, which you can run on your own Redshift Serverless datawarehouse to experience the benefits of this feature.
What are the benefits of data management platforms? Modern, data-driven marketing teams must navigate a web of connected data sources and formats. All this data arrives by the terabyte, and a data management platform can help marketers make sense of it all. Of course, marketing also works.
Large-scale datawarehouse migration to the cloud is a complex and challenging endeavor that many organizations undertake to modernize their data infrastructure, enhance data management capabilities, and unlock new business opportunities. This makes sure the new data platform can meet current and future business goals.
Use case A typical workload for AWS Glue for Apache Spark jobs is to load data from a relational database to a datalake with SQL-based transformations. On the Graphed metrics tab, configure your preferred statistic, period, and so on. When the example job ran, the workerUtilization metrics showed the following trend.
We are excited to announce the General Availability of AWS Glue Data Quality. Our journey started by working backward from our customers who create, manage, and operate datalakes and datawarehouses for analytics and machine learning. It takes days for data engineers to identify and implement data quality rules.
All of the statistics from IDC and the others show that there’s a massive market for digital services. The next area is data. There’s a huge disruption around data. Increasingly now, we can bring the technology to the data rather than the other way around. The first is the new digital opportunities.
Let’s consider the differences between the two, and why they’re both important to the success of data-driven organizations. Digging into quantitative data. This is quantitative data. It’s “hard,” structured data that answers questions such as “how many?” Qualitative data benefits: Unlocking understanding.
Mark: The first element in the process is the link between the source data and the entry point into the data platform. At Ramsey International (RI), we refer to that layer in the architecture as the foundation, but others call it a staging area, raw zone, or even a source datalake. What is a data fabric?
Uber understood that digital superiority required the capture of all their transactional data, not just a sampling. They stood up a file-based datalake alongside their analytical database. Because much of the work done on their datalake is exploratory in nature, many users want to execute untested queries on petabytes of data.
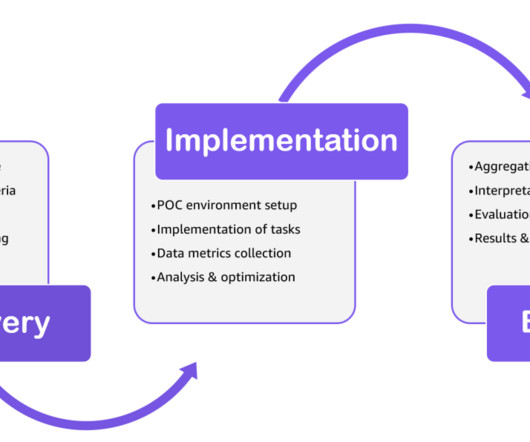
Amazon Redshift is a fast, scalable, and fully managed cloud datawarehouse that allows you to process and run your complex SQL analytics workloads on structured and semi-structured data. Complete the implementation tasks such as data ingestion and performance testing. Analyze the data and then optimize as necessary.
Though you may encounter the terms “data science” and “data analytics” being used interchangeably in conversations or online, they refer to two distinctly different concepts. Meanwhile, data analytics is the act of examining datasets to extract value and find answers to specific questions.
Data is usually visualized in a pictorial or graphical form such as charts, graphs, lists, maps, and comprehensive dashboards that combine these multiple formats. Data visualization is used to make the consuming, interpreting, and understanding data as simple as possible, and to make it easier to derive insights from data.
You can then run enhanced analysis on this DynamoDB data with the rich capabilities of Amazon Redshift, such as high-performance SQL, built-in machine learning (ML) and Spark integrations, materialized views (MV) with automatic and incremental refresh, data sharing, and the ability to join data across multiple data stores and datalakes.
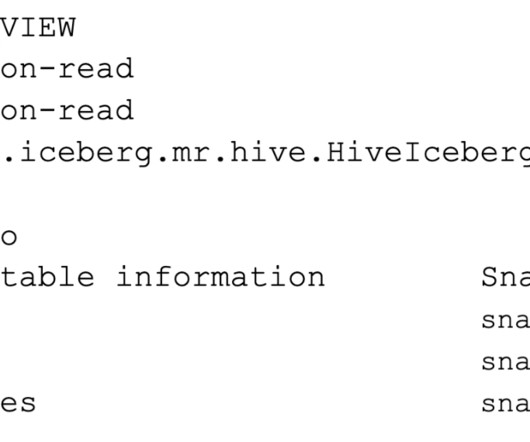
Cloudera DataWarehouse (CDW) running Hive has previously supported creating materialized views against Hive ACID source tables. release and the matching CDW Private Cloud Data Services release, Hive also supports creating, using, and rebuilding materialized views for Iceberg table format.
To verify the data quality of the sources through statistically-relevant metrics, AWS Glue Data Quality runs data quality tasks on relevant AWS Glue tables. Foundations for a datalake with data governance controls and data quality checks.
In this way, a data scientist benefits from business knowledge that they might not otherwise have access to. The catalog facilitates the synergy of the domain experts’ subject matter expertise with the data scientists statistical and coding expertise. Modern data catalogs surface a wide range of data asset types.
The purpose of this step is to understand our data quality statistics at the table level as well as at the ruleset level. Use the queries in this section to analyze your data quality metrics and create an Athena view to use to build a QuickSight dashboard in the next step.
Of course it can be argued that you can use statistics (and Google Trends in particular) to prove anything [1] , but I found the above figures striking. An obvious parallel in my world is to consider another business activity that reached peak popularity in the 2000s, DataWarehouse programmes [4]. Source: Google Trends.
Consider the problematic issue of manually mapping source system fields (typically source files or database tables) to target system fields (such as different tables in target datawarehouses or data marts). Creating a High-Quality Data Pipeline.
At a certain point, as the demand keeps growing, the data volumes rapidly increase. Data is no longer stored in CSV files, but in a dedicated, purpose built datalake / datawarehouse. F-statistic: 599.7 The challenges surface once the company hits the scalability wall.
Additionally, they provide tabs, pull-down menus, and other navigation features to assist in accessing data. Data Visualizations : Dashboards are configured with a variety of data visualizations such as line and bar charts, bubble charts, heat maps, and scatter plots to show different performance metrics and statistics.
What Are the Top Data Challenges to Analytics? The proliferation of data sources means there is an increase in data volume that must be analyzed. Large volumes of data have led to the development of datalakes , datawarehouses, and data management systems.
Data and Analytics Governance: Whats Broken, and What We Need To Do To Fix It. Link Data to Business Outcomes. Does Datawarehouse as a software tool will play role in future of Data & Analytics strategy? Datalakes don’t offer this nor should they. E.g. DataLakes in Azure – as SaaS.
That was the Science, here comes the Technology… A Brief Hydrology of DataLakes. Even back then, these were used for activities such as Analytics , Dashboards , Statistical Modelling , Data Mining and Advanced Visualisation. This is the essence of Convergent Evolution. In Closing.
And it’s become a hyper-competitive business, so enhancing customer service through data is critical for maintaining customer loyalty. For example auto insurance companies offering to capture real-time driving statistics from policy-holders’ cars to encourage and reward safe driving. In data-driven organizations, data is flowing.
He went on to be the head brewer of Guinness and we thank him for not just great hand-crafted beers but subsequent research breakthroughs in statistical research as well. Data allowed Guinness to hold their market dominance for long. Data mining. That was in the 1900’s.
Let’s look at the data architecture journey to understand why and how data lakehouses help to solve complexity, value and security. Traditionally, datawarehouses have stored curated, structured data to support analytics and business intelligence, with fast, easy access to data. Want to learn more?
The key components of a data pipeline are typically: Data Sources : The origin of the data, such as a relational database , datawarehouse, datalake , file, API, or other data store. This can include tasks such as data ingestion, cleansing, filtering, aggregation, or standardization.
We organize all of the trending information in your field so you don't have to. Join 42,000+ users and stay up to date on the latest articles your peers are reading.
You know about us, now we want to get to know you!
Let's personalize your content
Let's get even more personalized
We recognize your account from another site in our network, please click 'Send Email' below to continue with verifying your account and setting a password.


Let's personalize your content