This site uses cookies to improve your experience. To help us insure we adhere to various privacy regulations, please select your country/region of residence. If you do not select a country, we will assume you are from the United States. Select your Cookie Settings or view our Privacy Policy and Terms of Use.
Cookie Settings
Cookies and similar technologies are used on this website for proper function of the website, for tracking performance analytics and for marketing purposes. We and some of our third-party providers may use cookie data for various purposes. Please review the cookie settings below and choose your preference.
Used for the proper function of the website
Used for monitoring website traffic and interactions
Cookie Settings
Cookies and similar technologies are used on this website for proper function of the website, for tracking performance analytics and for marketing purposes. We and some of our third-party providers may use cookie data for various purposes. Please review the cookie settings below and choose your preference.
Strictly Necessary: Used for the proper function of the website
Performance/Analytics: Used for monitoring website traffic and interactions
licensed, 100% open-source data table format that helps simplify data processing on large datasets stored in datalakes. Data engineers use Apache Iceberg because it’s fast, efficient, and reliable at any scale and keeps records of how datasets change over time.
Datalakes and data warehouses are two of the most important data storage and management technologies in a modern data architecture. Datalakes store all of an organization’s data, regardless of its format or structure.
In the context of comprehensive data governance, Amazon DataZone offers organization-wide data lineage visualization using Amazon Web Services (AWS) services, while dbt provides project-level lineage through model analysis and supports cross-project integration between datalakes and warehouses.
In the era of big data, datalakes have emerged as a cornerstone for storing vast amounts of raw data in its native format. They support structured, semi-structured, and unstructured data, offering a flexible and scalable environment for data ingestion from multiple sources.
With this new functionality, customers can create up-to-date replicas of their data from applications such as Salesforce, ServiceNow, and Zendesk in an Amazon SageMaker Lakehouse and Amazon Redshift. SageMaker Lakehouse gives you the flexibility to access and query your data in-place with all Apache Iceberg compatible tools and engines.
In the first post of this series , we described how AWS Glue for Apache Spark works with Apache Hudi, Linux Foundation Delta Lake, and Apache Iceberg datasets tables using the native support of those datalake formats. Even without prior experience using Hudi, Delta Lake or Iceberg, you can easily achieve typical use cases.
Apache Hudi is an open table format that brings database and data warehouse capabilities to datalakes. Apache Hudi helps data engineers manage complex challenges, such as managing continuously evolving datasets with transactions while maintaining query performance. Create your S3 bucket if you do not have it.
These processes retrieve data from around 90 different data sources, resulting in updating roughly 2,000 tables in the data warehouse and 3,000 external tables in Parquet format, accessed through Amazon Redshift Spectrum and a datalake on Amazon Simple Storage Service (Amazon S3). TB of data.
Amazon Redshift Serverless makes it simple to run and scale analytics without having to manage your data warehouse infrastructure. For Filter by resource type , you can filter by Workgroup , Namespace , Snapshot , and Recovery Point. For this post, we don’t include any tag filters, so we can view all the resources across our account.
Amazon Redshift is a popular cloud data warehouse, offering a fully managed cloud-based service that seamlessly integrates with an organization’s Amazon Simple Storage Service (Amazon S3) datalake, real-time streams, machine learning (ML) workflows, transactional workflows, and much more—all while providing up to 7.9x
When setting out to build a data warehouse, it’s a common pattern to have a datalake as the source of the data warehouse. The datalake in this context serves a number of important functions: It acts as a central source for multiple applications, not just exclusively for data warehousing purposes.
With Kinesis Data Streams, customers can continuously capture terabytes of time series data from thousands of sources for cleaning, enrichment, storage, analysis, and visualization. The raw data can be streamed to Amazon S3 for archiving. Grafana supports data sources that are storage backends for time series data.
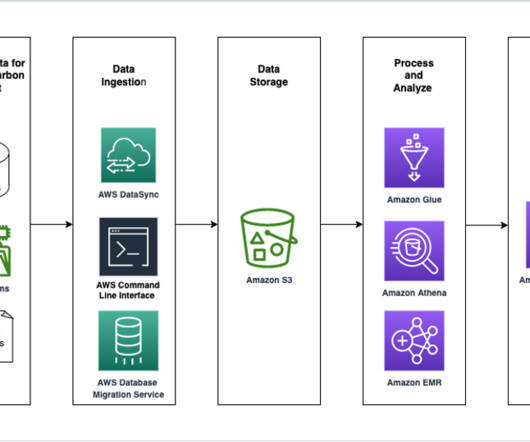
The data architecture diagram below shows an example of how you could use AWS services to calculate and visualize an organization’s estimated carbon footprint. Customers have the flexibility to choose the services in each stage of the data pipeline based on their use case. usage_therms", "gasutilization"."usage_scf"
Furthermore, data events are filtered, enriched, and transformed to a consumable format using a stream processor. The result is made available to the application by querying the latest snapshot. OpenSearch Service offers visualization capabilities powered by OpenSearch Dashboards and Kibana (1.5
Namespaces group together all of the resources you use in Redshift Serverless, such as schemas, tables, users, datashares, and snapshots. First, we need to give our Redshift namespace permission via AWS Identity and Access Management (IAM) to access subscriptions on AWS Data Exchange. Select Directly query your data.
Data mapping involves identifying and documenting the flow of personal data in an organization. It helps organizations understand how personal data moves through their systems, where it is stored, and how it is processed. Note that putting a comprehensive data strategy in place is not in scope for this post.
With data volumes exhibiting a double-digit percentage growth rate year on year and the COVID pandemic disrupting global logistics in 2021, it became more critical to scale and generate near-real-time data. You can visually create, run, and monitor extract, transform, and load (ETL) pipelines to load data into your datalakes.
This gives a visual representation of peaks and lows in your consumption over your chosen period of time. Choose your level of metrics to monitor: Workgroup Namespace Snapshot storage If we select Workgroup , we can choose from the workgroup-level metrics shown in the following screenshot. Ashish has over 24 years of experience in IT.
We show how to perform extract, transform, and load (ELT), an integration process focused on getting the raw data from a datalake into a staging layer to perform the modeling. We use our data mart to visually present the facts in the form of a dashboard. We use this dataset to visualize the data mart.
Building datalakes from continuously changing transactional data of databases and keeping datalakes up to date is a complex task and can be an operational challenge. You can then apply transformations and store data in Delta format for managing inserts, updates, and deletes.
We can determine the following are needed: An open data format ingestion architecture processing the source dataset and refining the data in the S3 datalake. This requires a dedicated team of 3–7 members building a serverless datalake for all data sources. Vijay Bagur is a Sr.
A Better Way Forward: Cloudera’s Open Data Lakehouse Cloudera offers a solution to these challenges with its open data lakehouse, which combines the flexibility and scalability of datalake storage with data warehouse functionality to unify and simplify the management of cyber log data.
For example, a Jupyter notebook in CML, can use Spark or Python framework to directly access an Iceberg table to build a forecast model, while new data is ingested via NiFi flows, and a SQL analyst monitors revenue targets using DataVisualization. 2: Open formats. Financial regulation. Reproducibility for ML Ops.
While aggregating, summarizing, and aligning to a common information model, all transformations must not affect the integrity of data from its source. The solution Tricentis Analytics aims to address the challenges of high volume, near-real-time, and visually appealing reporting and analytics across the entire Tricentis product portfolio.
Today, many customers build data quality validation pipelines using its Data Quality Definition Language (DQDL) because with static rules, dynamic rules , and anomaly detection capability , its fairly straightforward. One of its key features is the ability to manage data using branches. additional_python_modules pandas==2.2
A Better Way Forward: Cloudera’s Open Data Lakehouse Cloudera offers a solution to these challenges with its open data lakehouse, which combines the flexibility and scalability of datalake storage with data warehouse functionality to unify and simplify the management of cyber log data.
We organize all of the trending information in your field so you don't have to. Join 42,000+ users and stay up to date on the latest articles your peers are reading.
You know about us, now we want to get to know you!
Let's personalize your content
Let's get even more personalized
We recognize your account from another site in our network, please click 'Send Email' below to continue with verifying your account and setting a password.


Let's personalize your content