This site uses cookies to improve your experience. To help us insure we adhere to various privacy regulations, please select your country/region of residence. If you do not select a country, we will assume you are from the United States. Select your Cookie Settings or view our Privacy Policy and Terms of Use.
Cookie Settings
Cookies and similar technologies are used on this website for proper function of the website, for tracking performance analytics and for marketing purposes. We and some of our third-party providers may use cookie data for various purposes. Please review the cookie settings below and choose your preference.
Used for the proper function of the website
Used for monitoring website traffic and interactions
Cookie Settings
Cookies and similar technologies are used on this website for proper function of the website, for tracking performance analytics and for marketing purposes. We and some of our third-party providers may use cookie data for various purposes. Please review the cookie settings below and choose your preference.
Strictly Necessary: Used for the proper function of the website
Performance/Analytics: Used for monitoring website traffic and interactions
But data alone is not the answer—without a means to interact with the data and extract meaningful insight, it’s essentially useless. Business intelligence (BI) software can help by combining online analytical processing (OLAP), location intelligence, enterprise reporting, and more. Let’s introduce the concept of datamining.
Well, it is – to the ones that are 100% familiar with it – and it involves the use of various data sources, including internal data from company databases, as well as external data, to generate insights, identify trends, and support strategic planning. Role of BI in Modern Enterprises What’s the goal and role of this data giant?
The consequences of bad data quality are numerous; from the accuracy of understanding your customers to constructing the right business decisions. That’s why it is of utmost importance to start with utilizing the right keyperformanceindicators – there are numerous KPI examples that can make or break the quality process of data management.
Transforming Industries with Data Intelligence. Data intelligence has provided useful and insightful information to numerous markets and industries. With tools such as Artificial Intelligence, Machine Learning, and DataMining, businesses and organizations can collate and analyze large amounts of data reliably and more efficiently.
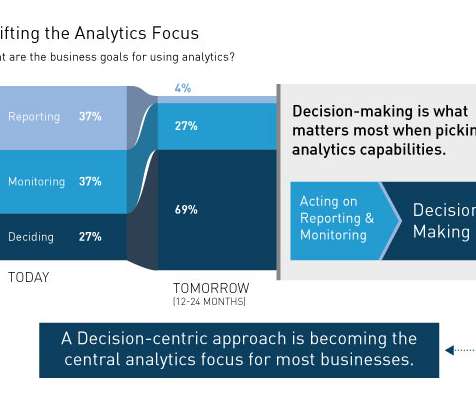
The research looked at the increasingly broad portfolio of analytic capabilities available to enterprises – everything from traditional Business Intelligence (BI) capabilities like reporting and ad-hoc queries to modern visualization and data discovery capabilities as well as advanced (predictive) analytics. Monitoring.
But if you find a development opportunity, and see that your business performance can be significantly improved, then a KPI dashboard software could be a smart investment to monitor your keyperformanceindicators and provide a transparent overview of your company’s data. Dirty data is costing you.
Founded in the ’70s, this software offers a range of products and applications that allow for statistical analysis, predictive analytics, datamining, text mining, and forecasting. Like this, users can perform efficient reporting, generate forecasts, visualize their data, and share it from any location.
Following a legislative review of state purchases in fiscal year 2022, the state of Oklahoma discovered that its agencies had procured more than $3 billion worth of goods and services outside the oversight of its Office of Management and Enterprise (OMES) Central Purchasing division.
Like many enterprises, you’ve likely made a hefty investment in analytic technology—from interactive dashboards and advanced visualization tools to datamining, predictive analytics, machine learning (ML), and artificial intelligence (AI). Focusing on decision-making changes everything.
A BI dashboard — or business intelligence dashboard — is an information management tool that uses data visualization to display KPIs (keyperformanceindicators) tracked by a business to assess various aspects of performance. They offer a free community edition and an Enterprise Edition. Conclusion.
Thanks to the recent technological innovations and circumstances to their rapid adoption, having a data warehouse has become quite common in various enterprises across sectors. Keyperformanceindicators (KPIs) are a necessary component of any business intelligence strategy.
Success criteria alignment by all stakeholders (producers, consumers, operators, auditors) is key for successful transition to a new Amazon Redshift modern data architecture. The success criteria are the keyperformanceindicators (KPIs) for each component of the data workflow. Vijay Bagur is a Sr.
A BI dashboard — or business intelligence dashboard — is an information management tool that uses data visualization to display KPIs (keyperformanceindicators) tracked by a business to assess various aspects of performance. They offer a free community edition and an Enterprise Edition. Conclusion.
Other challenges include communicating results to non-technical stakeholders, ensuring data security, enabling efficient collaboration between data scientists and data engineers, and determining appropriate keyperformanceindicator (KPI) metrics.
Daily, data analysts engage in various tasks tailored to their organization’s needs, including identifying efficiency improvements, conducting sector and competitor benchmarking, and implementing tools for data validation. The business department can view reports or update data fillings.
A BI dashboard — or business intelligence dashboard — is an information management tool that uses data visualization to display KPIs (keyperformanceindicators) tracked by a business to assess various aspects of performance. They offer a free community edition and an Enterprise Edition. Conclusion.
Convert Data Skeptics: Document, Educate & Pick Your Poison. DataMining And Predictive Analytics On Web Data Works? Web Analytics Data Sampling 411. Podcast: Being Data-Driven, Exploiting the Long Tail, Analyst Skills. Redefining Conventional Wisdom On "Enterprise Class" Web Analytics.
Traditional data sources like end of month statements and quarterly reports are no longer enough. Access to enterprise-wide information fuels analytics solutions and enable a new approach for decision making. Key Language of Applied Analytics. Master data management. Data governance. Primary keys.
Users Want to Help Themselves Datamining is no longer confined to the research department. Today, every professional has the power to be a “data expert.” They can gather information on their own to make key business decisions. These tools enable users to quickly draw conclusions and monitor keyperformanceindicators.
We organize all of the trending information in your field so you don't have to. Join 42,000+ users and stay up to date on the latest articles your peers are reading.
You know about us, now we want to get to know you!
Let's personalize your content
Let's get even more personalized
We recognize your account from another site in our network, please click 'Send Email' below to continue with verifying your account and setting a password.
Let's personalize your content