This site uses cookies to improve your experience. To help us insure we adhere to various privacy regulations, please select your country/region of residence. If you do not select a country, we will assume you are from the United States. Select your Cookie Settings or view our Privacy Policy and Terms of Use.
Cookie Settings
Cookies and similar technologies are used on this website for proper function of the website, for tracking performance analytics and for marketing purposes. We and some of our third-party providers may use cookie data for various purposes. Please review the cookie settings below and choose your preference.
Used for the proper function of the website
Used for monitoring website traffic and interactions
Cookie Settings
Cookies and similar technologies are used on this website for proper function of the website, for tracking performance analytics and for marketing purposes. We and some of our third-party providers may use cookie data for various purposes. Please review the cookie settings below and choose your preference.
Strictly Necessary: Used for the proper function of the website
Performance/Analytics: Used for monitoring website traffic and interactions
Agree companywide what KPIs are most relevant for your business and how do they already develop. Research different KPI examples and compare to your own. If nothing can be changed, there is no point of analyzing data. If nothing can be changed, there is no point of analyzing data. Can you influence this development?
Modern data architectures must be designed for security, and they must support data policies and access controls directly on the raw data, not in a web of downstream data stores and applications. Curate the data. Establish a common vocabulary.
The consequences of bad data quality are numerous; from the accuracy of understanding your customers to constructing the right business decisions. That’s why it is of utmost importance to start with utilizing the right key performance indicators – there are numerous KPI examples that can make or break the quality process of data management.
What Is A Data Analysis Method? Data analysis method focuses on strategic approaches to taking raw data, mining for insights that are relevant to the business’s primary goals, and drilling down into this information to transform metrics, facts, and figures into initiatives that benefit improvement.
And it’s data, and property binding requires too much time to fix in the report. KNIME is an open-source BI tool specialized for data linkage, integration, and analysis. It provides data scientists and BI executives with datamining, machine learning, and data visualization capabilities to build effective data pipelines. .
Data cleansing, metadata management, data distribution, storage management, recovery, and backup planning are processes conducted in a data warehouse while BI makes use of tools that focus on statistics, visualization, and datamining. But let’s see this through our next major aspect. c) What is the audience?
From datamining and spreadsheets to local information systems, each available data solution plays a different role in maximizing value creation. When this is done, it will be much easier for you to choose from lists of KPI examples the ones that will fit your audience best. Marketing KPI dashboard. 10) Refine.
Transforming Industries with Data Intelligence. Data intelligence has provided useful and insightful information to numerous markets and industries. With tools such as Artificial Intelligence, Machine Learning, and DataMining, businesses and organizations can collate and analyze large amounts of data reliably and more efficiently.
If you don’t have the ability (or desire) to ask your end-user what KPIs are valuable to them, our KPI examples and templates will give you a pretty good idea of what metrics you can use. e) How are they currently viewing these KPIs? However, even though we love data, we can’t (and shouldn’t) display all of these types.
Predictive analytics : This method uses advanced statistical techniques coming from datamining and machine learning technologies to analyze current and historical data and generate accurate predictions. That is the difference between business intelligence & analytics, and that’s why both of them are crucial.
This phase also involves conducting holistic performance testing (individual queries, batch loads, consumption reports and dashboards in BI tools, datamining applications, ML algorithms, and other relevant use cases) in addition to functional testing to make sure the converted code meets the required performance expectations.
The three components of Business Intelligence are: Data Strategy:a clearly defined plan of action that outlines how an organization will collect, store, process, and use data in order to achieve specific goals. Data governance and security measures are critical components of data strategy.
The three components of Business Intelligence are: Data Strategy:a clearly defined plan of action that outlines how an organization will collect, store, process, and use data in order to achieve specific goals. Data governance and security measures are critical components of data strategy.
Founded in the ’70s, this software offers a range of products and applications that allow for statistical analysis, predictive analytics, datamining, text mining, and forecasting. Your Chance: Want to start your business intelligence journey today? SAS BI: SAS can be considered the “mother” of all BI tools.
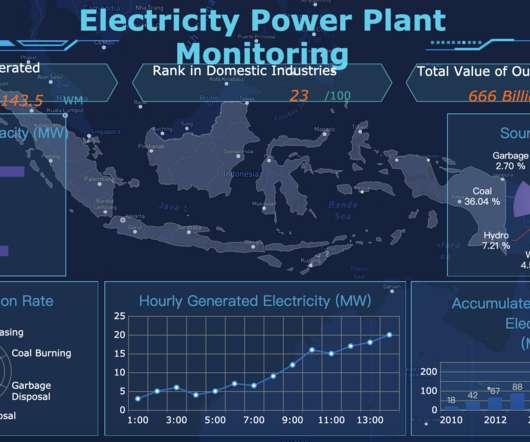
Sama halnya seperti dashboard pesawat, ia menampilkan indikator performa utama dari sebuah perusahaan melalui berbagai grafik yang umum (speedometer, kolom volum, radar peringatan dini, bola radar, dll), jadi para manajer dapat memantau operasi bisnis secara intuitif, membuat peringatan dini dan menganalisis datamining dari indikator yang abnormal.
Other challenges include communicating results to non-technical stakeholders, ensuring data security, enabling efficient collaboration between data scientists and data engineers, and determining appropriate key performance indicator (KPI) metrics.
Visualisasi komponen ini digunakan untuk menampilkan data secara berbeda, dengan tujuan menampilkan informasi secara akurat yang dapat digunakan oleh pengguna akhir. KPI dapat dilacak melalui dashboard di layar TV dalam meeting. Pemahaman bisnis berarti analisis data yang mendalam dan prakiraan cerdas data.
Visualisasi komponen ini digunakan untuk menampilkan data secara berbeda, dengan tujuan menampilkan informasi secara akurat yang dapat digunakan oleh pengguna akhir. KPI dapat dilacak melalui dashboard di layar TV dalam meeting. Pemahaman bisnis berarti analisis data yang mendalam dan prakiraan cerdas data.
" ~ Web Metrics: "What is a KPI? Convert Data Skeptics: Document, Educate & Pick Your Poison. DataMining And Predictive Analytics On Web Data Works? Web Analytics Data Sampling 411. Podcast: Google, Evangelism, Data Privacy, Analytics, Yahoo! & Web Metrics: "What is a KPI?
We organize all of the trending information in your field so you don't have to. Join 42,000+ users and stay up to date on the latest articles your peers are reading.
You know about us, now we want to get to know you!
Let's personalize your content
Let's get even more personalized
We recognize your account from another site in our network, please click 'Send Email' below to continue with verifying your account and setting a password.


Let's personalize your content