This site uses cookies to improve your experience. To help us insure we adhere to various privacy regulations, please select your country/region of residence. If you do not select a country, we will assume you are from the United States. Select your Cookie Settings or view our Privacy Policy and Terms of Use.
Cookie Settings
Cookies and similar technologies are used on this website for proper function of the website, for tracking performance analytics and for marketing purposes. We and some of our third-party providers may use cookie data for various purposes. Please review the cookie settings below and choose your preference.
Used for the proper function of the website
Used for monitoring website traffic and interactions
Cookie Settings
Cookies and similar technologies are used on this website for proper function of the website, for tracking performance analytics and for marketing purposes. We and some of our third-party providers may use cookie data for various purposes. Please review the cookie settings below and choose your preference.
Strictly Necessary: Used for the proper function of the website
Performance/Analytics: Used for monitoring website traffic and interactions
Rapidminer is a visual enterprise data science platform that includes data extraction, datamining, deep learning, artificial intelligence and machine learning (AI/ML) and predictive analytics. It can support AI/ML processes with data preparation, model validation, results visualization and model optimization.
If you are planning on using predictive algorithms, such as machine learning or datamining, in your business, then you should be aware that the amount of data collected can grow exponentially over time.
It must be based on historical data, facts and clear insight into trends and patterns in the market, the competition and customer buying behavior. According to CIO publications, the predictive analytics market was estimated at $12.5 billion USD in 2022 and is expected to reach $38 billion USD by 2028.
Business analytics is a subset of data analytics. Data analytics is used across disciplines to find trends and solve problems using datamining , data cleansing, data transformation, datamodeling, and more. What is the difference between business analytics and business intelligence?
Predictive analytics, sometimes referred to as big data analytics, relies on aspects of datamining as well as algorithms to develop predictivemodels. Predictivemodels are sure to change the landscape or many businesses.
Accordingly, predictive and prescriptive analytics are by far the most discussed business analytics trends among the BI professionals, especially since big data is becoming the main focus of analytics processes that are being leveraged not just by big enterprises, but small and medium-sized businesses alike.
Predictive analytics in business Predictive analytics draws its power from a wide range of methods and technologies, including big data, datamining, statistical modeling, machine learning, and assorted mathematical processes. from 2022 to 2028. As such it can help adopters find ways to save and earn money.
CompTIA Data+ The CompTIA Data+ certification is an early-career data analytics certification that validates the skills required to facilitate data-driven business decision-making. Individuals with the certificate can describe data ecosystems and compose queries to access data in cloud databases using SQL and Python.
Customer purchase patterns, supply chain, inventory, and logistics represent just a few domains where we see new and emergent behaviors, responses, and outcomes represented in our data and in our predictivemodels.
Data analytics draws from a range of disciplines — including computer programming, mathematics, and statistics — to perform analysis on data in an effort to describe, predict, and improve performance. What are the four types of data analytics? Data analytics vs. business analytics.
Cost: $180 per exam Location: Online Duration: Self-paced Expiration: Credentials do not expire SAS Certified Advanced Analytics Professional The SAS Certified Advanced Analytics Professional credential validates your ability to analyze big data with a variety of statistical analysis and predictivemodeling techniques.
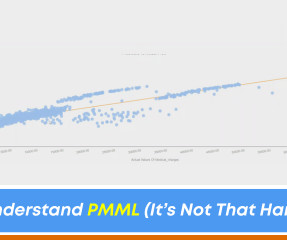
Incorporate PMML Integration Within Augmented Analytics to Easily Manage PredictiveModels! PMML is PredictiveModel Markup Language. It is an interchange format that provides a method by which analytical applications and software can describe and exchange predictivemodels. So, what is PMML Integration?
Data is processed to generate information, which can be later used for creating better business strategies and increasing the company’s competitive edge. It doesn’t matter if you use graphs or charts, you need to get better at data visualization.
KNIME is an open-source BI tool specialized for data linkage, integration, and analysis. It provides data scientists and BI executives with datamining, machine learning, and data visualization capabilities to build effective data pipelines. .
There are four main types of data analytics: Predictivedata analytics: It is used to identify various trends, causation, and correlations. It can be further classified as statistical and predictivemodeling, but the two are closely associated with each other.
Predictive analytics continues to gain popularity, and research proves that there is a gradual move toward credit scoring strategies developed using datamining and predictive analytics.
These tools are used for a variety of data-related tasks, ranging from extracting and cleaning data, to subjecting data to algorithmic analysis via statistical methods or machine learning. Tableau: Now owned by Salesforce, Tableau is a data visualization tool.
The ‘data’ part is the statistics and data display. . Business understanding’ is realizing in-depth data analysis and smart data forecasting via analysis and prediction functions such as datamining, predictivemodeling, and so on.
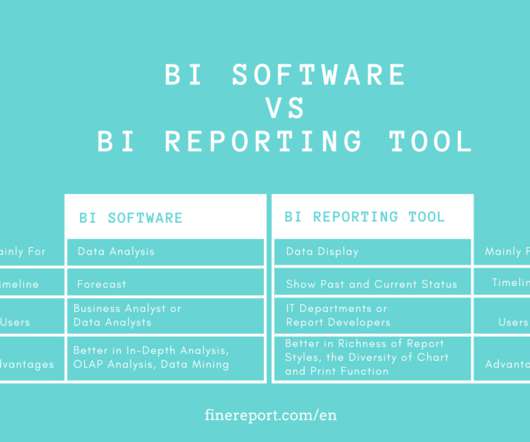
There is not a clear line between business intelligence and analytics, but they are extremely connected and interlaced in their approach towards resolving business issues, providing insights on past and present data, and defining future decisions.
BA is a catch-all expression for approaches and technologies you can use to access and explore your company’s data, with a view to drawing out new, useful insights to improve business planning and boost future performance. BA primarily predicts what will happen in the future. What About “Business Intelligence”?
Machine learning can improve operations, but only when its predictivemodels are deployed, integrated, and—most importantly—acted upon. But how do they ensure that it truly serves their business operations in the most optimal way? After all, the end goal is to achieve better business outcomes.
This iterative process is known as the data science lifecycle, which usually follows seven phases: Identifying an opportunity or problem Datamining (extracting relevant data from large datasets) Data cleaning (removing duplicates, correcting errors, etc.)
These libraries are used for data collection, analysis, datamining, visualizations, and ML modeling. There are also a wide array of libraries available for both languages for text processing, text analysis, and text modeling. Python has 200+ standard libraries and nearly infinite third-party libraries.
Today’s Advanced Analytics Tools allow business users to leverage features like self-serve data preparation, smart data visualization and assisted predictivemodeling.
Smarten Augmented Analytics represents the evolution of the ElegantJ BI approach to business intelligence, and the significance of self-serve data preparation, smart visualization, and assisted predictivemodeling.
Kunci untuk software BI adalah “data+pemahaman bisnis” Bagian ‘”data” diatas adalah statistik dan tampilan data. Ini membantu Anda untuk memahami mengapa performa saat ini demikian dan cara meningkatkannya.
The fields have evolved such that to work as a data analyst who views, manages and accesses data, you need to know Structured Query Language (SQL) as well as math, statistics, data visualization (to present the results to stakeholders) and datamining.
As the analytical solutions market evolves, the advent of self-serve tools provides business users with the ability to leverage self-serve data preparation, smart data visualization and assisted predictivemodeling and operate at a level that was not possible before.
One of the best ways to take advantage of social media data is to implement text-mining programs that streamline the process. What is text mining? Text analysis takes it a step farther by focusing on pattern identification across large datasets, producing more quantitative results.
Acting as a comprehensive solution, the best BI tools collect and analyze company data to generate easily interpretable graphs, reports, and charts , leveraging advanced datamining, analytics, and visualization techniques. Best BI Tools for Data Analysts 3.1
Advanced analytics help detect known and unknown threats to drive consistent and faster investigations every time and empower your security analysts to make data-driven decisions. With ML analytics models, your organization can gain additional insight into user behavior with predictivemodeling and baselines of what is normal for a user.
Through the utilization of predictivemodels, clinicians can forecast patient outcomes and resource needs, enabling early intervention and personalized care delivery. Furthermore, the implementation of healthcare datamining techniques allows organizations to uncover hidden patterns and correlations within their datasets.
The plot below is an example of PDPs that show the impact of changes in features like temperature, humidity, and wind speed on the predicted number of rented bikes. PDPs for the bicycle count predictionmodel (Molnar, 2009). Creating a PDP for our model is fairly straightforward. Guestrin, C., Why should I trust you?:
Machine Learning Pipelines : These pipelines support the entire lifecycle of a machine learning model, including data ingestion , data preprocessing, model training, evaluation, and deployment. API Data Pipelines : These pipelines retrieve data from various APIs and load it into a database or application for further use.
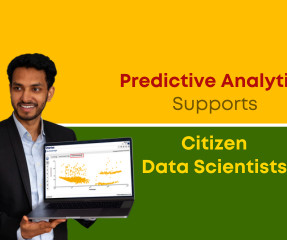
Users Want to Help Themselves Datamining is no longer confined to the research department. Today, every professional has the power to be a “data expert.” Predictive analytics use a combination of data sets from multiple sources to find relationships and correlations. Standalone is a thing of the past.
We organize all of the trending information in your field so you don't have to. Join 42,000+ users and stay up to date on the latest articles your peers are reading.
You know about us, now we want to get to know you!
Let's personalize your content
Let's get even more personalized
We recognize your account from another site in our network, please click 'Send Email' below to continue with verifying your account and setting a password.


Let's personalize your content