This site uses cookies to improve your experience. To help us insure we adhere to various privacy regulations, please select your country/region of residence. If you do not select a country, we will assume you are from the United States. Select your Cookie Settings or view our Privacy Policy and Terms of Use.
Cookie Settings
Cookies and similar technologies are used on this website for proper function of the website, for tracking performance analytics and for marketing purposes. We and some of our third-party providers may use cookie data for various purposes. Please review the cookie settings below and choose your preference.
Used for the proper function of the website
Used for monitoring website traffic and interactions
Cookie Settings
Cookies and similar technologies are used on this website for proper function of the website, for tracking performance analytics and for marketing purposes. We and some of our third-party providers may use cookie data for various purposes. Please review the cookie settings below and choose your preference.
Strictly Necessary: Used for the proper function of the website
Performance/Analytics: Used for monitoring website traffic and interactions
Rapidminer is a visual enterprise data science platform that includes data extraction, datamining, deep learning, artificial intelligence and machine learning (AI/ML) and predictive analytics. It can support AI/ML processes with data preparation, model validation, results visualization and model optimization.
You may not even know exactly which path you should pursue, since some seemingly similar fields in the data technology sector have surprising differences. We decided to cover some of the most important differences between DataMining vs Data Science in order to finally understand which is which. What is Data Science?
Digital marketers can use datamining tools to assist them in a number of ways. Search engines crawl metadata of image files, videos and other visual creative when they are indexing websites. This data can play a very important role in SEO. You need to use datamining tools that provide more granular insights.
This article was published as a part of the Data Science Blogathon. Introduction Text Mining is also known as Text DataMining or Text Analytics or is an artificial intelligence (AI) technology that uses natural language processing (NLP) to extract essential data from standard language text.
Learn how DirectX visualization can improve your study and assessment of different trading instruments for maximum productivity and profitability. A growing number of traders are using increasingly sophisticated datamining and machine learning tools to develop a competitive edge. But first, What is DirectX Anyway?
This data alone does not make any sense unless it’s identified to be related in some pattern. Datamining is the process of discovering these patterns among the data and is therefore also known as Knowledge Discovery from Data (KDD). Machine learning provides the technical basis for datamining.
While quantitative analysis, operational analysis, and datavisualizations are key components of business analytics, the goal is to use the insights gained to shape business decisions. Business analytics is a subset of data analytics. The discipline is a key facet of the business analyst role. Business analytics techniques.
Data exploded and became big. Spreadsheets finally took a backseat to actionable and insightful datavisualizations and interactive business dashboards. The rise of self-service analytics democratized the data product chain. 2) Data Discovery/Visualization. We all gained access to the cloud.
k-means Clustering – Document clustering, Datamining. In datamining, k-means clustering is used to classify observations into groups of related observations with no predefined relationships. Hidden Markov Model – Pattern Recognition, Bioinformatics, Data Analytics. Source ].
This interdisciplinary field of scientific methods, processes, and systems helps people extract knowledge or insights from data in a host of forms, either structured or unstructured, similar to datamining. A must for any budding data scientist’s home library. An inspiring addition to our rundown of data science books.
What Is A Data Analysis Method? Data analysis method focuses on strategic approaches to taking raw data, mining for insights that are relevant to the business’s primary goals, and drilling down into this information to transform metrics, facts, and figures into initiatives that benefit improvement. Visualize your data.
Decision support systems are generally recognized as one element of business intelligence systems, along with data warehousing and datamining. These systems are often paired with datamining to sift through databases to produce data content relationships. Some experts consider BI a successor to DSS.
Data analytics draws from a range of disciplines — including computer programming, mathematics, and statistics — to perform analysis on data in an effort to describe, predict, and improve performance. What are the four types of data analytics? Data analytics and data science are closely related.
BI architecture has emerged to meet those requirements, with data warehousing as the backbone of these processes. One of the BI architecture components is data warehousing. Business intelligence and data warehousing have different goals. The output data of both terms also vary. click to enlarge**. b) What is the output?
But the benefits of BI extend beyond business decision-making, according to datavisualization vendor Tableau , including the following: Data-driven business decisions: The ability to drive business decisions with data is the central benefit of BI.
Methods like artificial neural networks (ANN) and autoregressive integrated moving average (ARIMA), time series, seasonal naïve approach, and datamining find wide application in data analytics nowadays. Your choice of method should depend on the type of data you’ve collected, your team’s skills, and your resources.
To simplify things, you can think of back-end BI skills as more technical in nature and related to building BI platforms, like online datavisualization tools. Front-end analytical and business intelligence skills are geared more towards presenting and communicating data to others. b) If You’re Already In The Workforce.
Data analytics technology can help immensely at this and all subsequent stages. Set Goals and Develop a Strategy with DataMining. This is one of the most important ways that big data can help. You may not need to use datamining to outline your goals, but you will probably need this technology to conceptualize them.
One new feature is the ability to create a radius, which wouldn’t be possible without the highly refined datamining and analytics features embedded in the core of the Google Maps algorithm. The Emerging Role of Big Data with Google Analytics. The highly intuitive data interface provided by Google Maps can be very helpful.
Candidates are required to complete a minimum of 12 credits, including four required courses: Algorithms for Data Science, Probability and Statistics for Data Science, Machine Learning for Data Science, and Exploratory Data Analysis and Visualization. Candidates have 90 minutes to complete the exam.
Business leaders, developers, data heads, and tech enthusiasts – it’s time to make some room on your business intelligence bookshelf because once again, datapine has new books for you to add. We have already given you our top datavisualization books , top business intelligence books , and best data analytics books.
Yo can use big data to make this easier. One option is to use datamining tools to learn more about the challenges people are making. You can assimilate data from various polls to learn more about the pain points of your target customers and create content that addresses them.
The final point to which the data has to be eventually transferred is a destination. The destination is decided by the use case of the data pipeline. It can be used to run analytical tools and power datavisualization as well. Otherwise, it can also be moved to a storage centre like a data warehouse or lake.
Predictive analytics : This method uses advanced statistical techniques coming from datamining and machine learning technologies to analyze current and historical data and generate accurate predictions. BI dashboards , offer the possibility to filter the data all in one screen to extract deeper conclusions.
Computer Vision: DataMining: Data Science: Application of scientific method to discovery from data (including Statistics, Machine Learning, datavisualization, exploratory data analysis, experimentation, and more). They provide more like an FAQ (Frequently Asked Questions) type of an interaction.
The right data analytics tools can be very valuable. Here are some financial analytics tools that are worth exploring: TrendingView is a financial analytics tool that helps you create useful financial visualizations. Data analytics tools make it easier to take a deep dive into your finances. Offer multiple payment options.
Data is processed to generate information, which can be later used for creating better business strategies and increasing the company’s competitive edge. Everyone has to manage raw data at one point or another; yet, not everybody stores it in a way that’s useful for further analysis or comparison to other data sets.
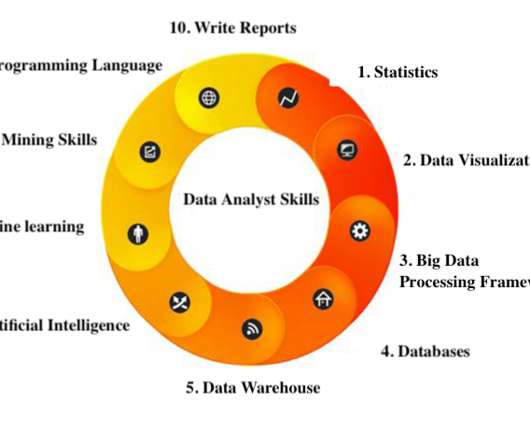
Framework Big Data Processing: Hadoop, storm, spark. Data Warehous: SSIS, SSAS. Skill DataMining: Matlab, R, Python. Seperti yang Anda ketahui, statistik adalah dasar analisis data. Statistik juga adalah sebuah skill utama seorang data analyst. Anda perlu memahami prinsip dibalik data.
These tools are used for a variety of data-related tasks, ranging from extracting and cleaning data, to subjecting data to algorithmic analysis via statistical methods or machine learning. Tableau: Now owned by Salesforce, Tableau is a datavisualization tool.
A BI dashboard — or business intelligence dashboard — is an information management tool that uses datavisualization to display KPIs (key performance indicators) tracked by a business to assess various aspects of performance while generating actionable insights. What Is The Purpose Of Using A BI Dashboard?
Besides, it offers data model creation, systematized data sets, developable web services, ML-powered algorithms, versatile use of datamining and so many other very efficient functionalities that make it very flexible and productive to use for Data Preprocessing.
Data architect role Data architects are senior visionaries who translate business requirements into technology requirements and define data standards and principles, often in support of data or digital transformations. In some ways, the data architect is an advanced data engineer.
Predictive analytics, sometimes referred to as big data analytics, relies on aspects of datamining as well as algorithms to develop predictive models. These predictive models can be used by enterprise marketers to more effectively develop predictions of future user behaviors based on the sourced historical data.
Most tools offer visual programming interfaces that enable users to drag and drop various icons optimized for data analysis. Visual IDE for data pipelines; RPA for rote tasks. The visual IDE offers more than 300 options that can be joined together to form a complex pipeline. Top predictive analytics tools compared.
Although compared to the paid version, not all free BI tool provides stunning datavisualization; they offer easy-to-understand charts that can meet your basic needs. KNIME is an open-source BI tool specialized for data linkage, integration, and analysis. Some of the free BI tools has its paid version. Tableau Public .
Business Intelligence describes the process of using modern data warehouse technology, data analysis and processing technology, datamining, and data display technology for visualizing, analyzing data, and delivering insightful information. What is Business Intelligence? BI dashboard (by FineReport).
Business intelligence (BI) analysts transform data into insights that drive business value. This is done by mining complex data using BI software and tools , comparing data to competitors and industry trends, and creating visualizations that communicate findings to others in the organization.
As a data analyst, you will learn several technical skills that data analysts need to be successful, including: Programming skills. Datavisualization capability. DataMining skills. Data wrangling ability. Machine learning knowledge.
That, along with datamining can help if the developer wants to work with supply chains, for example. These can help a developer find a career in the data science field. Software developers will also want to take classes in datavisualization and datamining. Machine Learning. Other coursework.
Some of the best are: Crazy Egg is a great website analytics tool that allows you to create visual heatmaps to see what website elements users are interacting with. Datamining tools make it easier for them to research their issues in depth. Datamining can help create amazing lead magnets. Offer Different Options.
Technicals such as data warehouse, online analytical processing (OLAP) tools, and datamining are often binding. On the opposite, it is more of a comprehensive application of data warehouse, OLAP, datamining, and so forth. Datavisualization analysis. BI software solutions (by FineReport).
This is one of the ways that big data can be most helpful. You can use sophisticated datamining tools to get the keywords you need to create a successful campaign. This is an overlooked area where big data can be highly useful. Make Useful Merchandise and Be Generous with Freebies.
They’re often responsible for building algorithms for accessing raw data, too, but to do this, they need to understand a company’s or client’s objectives, as aligning data strategies with business goals is important, especially when large and complex datasets and databases are involved.
Data engineers are often responsible for building algorithms for accessing raw data, but to do this, they need to understand a company’s or client’s objectives, as aligning data strategies with business goals is important, especially when large and complex datasets and databases are involved.
We organize all of the trending information in your field so you don't have to. Join 42,000+ users and stay up to date on the latest articles your peers are reading.
You know about us, now we want to get to know you!
Let's personalize your content
Let's get even more personalized
We recognize your account from another site in our network, please click 'Send Email' below to continue with verifying your account and setting a password.


Let's personalize your content