This site uses cookies to improve your experience. To help us insure we adhere to various privacy regulations, please select your country/region of residence. If you do not select a country, we will assume you are from the United States. Select your Cookie Settings or view our Privacy Policy and Terms of Use.
Cookie Settings
Cookies and similar technologies are used on this website for proper function of the website, for tracking performance analytics and for marketing purposes. We and some of our third-party providers may use cookie data for various purposes. Please review the cookie settings below and choose your preference.
Used for the proper function of the website
Used for monitoring website traffic and interactions
Cookie Settings
Cookies and similar technologies are used on this website for proper function of the website, for tracking performance analytics and for marketing purposes. We and some of our third-party providers may use cookie data for various purposes. Please review the cookie settings below and choose your preference.
Strictly Necessary: Used for the proper function of the website
Performance/Analytics: Used for monitoring website traffic and interactions
Recently, EUROGATE has developed a digital twin for its container terminal Hamburg (CTH), generating millions of data points every second from Internet of Things (IoT)devices attached to its container handling equipment (CHE). Their terminal operations rely heavily on seamless data flows and the management of vast volumes of data.
Whether your data streaming application is collecting clickstream data from a web application or recording telemetry data from billions of Internet of Things (IoT) devices, streaming applications are highly susceptible to a varying amount of data ingestion. One approach to this is to use enhanced shard-level metrics.
Data-driven insights are only as good as your data Imagine that each source of data in your organization—from spreadsheets to internet of things (IoT) sensor feeds—is a delegate set to attend a conference that will decide the future of your organization.
Whether it’s customer information, sales records, or sensor data from Internet of Things (IoT) devices, the importance of handling and storing data at scale with ease of use is paramount. In today’s data-driven world, organizations are continually confronted with the task of managing extensive volumes of data securely and efficiently.
This can be quantified by measuring metrics like tree cover, habitat integrity and number of species, and is guided by sustainable development principles. .” Similar to “carbon neutral” in the context of emissions, nature positive refers to stopping, avoiding and reversing environmental destruction.
The currently available choices include: The Amazon Redshift COPY command can load data from Amazon Simple Storage Service (Amazon S3), Amazon EMR , Amazon DynamoDB , or remote hosts over SSH. This native feature of Amazon Redshift uses massive parallel processing (MPP) to load objects directly from data sources into Redshift tables.
It takes an organization’s on-premises data into a private cloud infrastructure and then connects it to a public cloud environment, hosted by a public cloud provider. It also cuts carbon emissions by roughly 150 metric tons per year. To create a mobile financial marketplace, the bank used the IBM Garage Methodology.
This includes the ETL processes that capture source data, the functional refinement and creation of data products, the aggregation for business metrics, and the consumption from analytics, business intelligence (BI), and ML. KPIs evaluate the operational metrics, cost metrics, and end-user response time metrics.
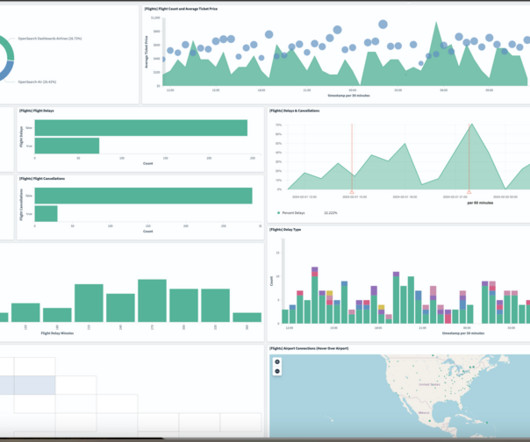
In this blog post, we delve into the intricacies of building a reliable data analytics pipeline that can scale to accommodate millions of vehicles, each generating hundreds of metrics every second using Amazon OpenSearch Ingestion. sink: - opensearch: # Provide an AWS OpenSearch Service domain endpoint hosts: [ "[link]. >
At CMU I joined a panel hosted by Zachary Lipton where someone in the audience asked a question about machine learning model interpretation. If your “performance” metrics are focused on predictive power, then you’ll probably end up with more complex models, and consequently less interpretable ones. Let’s look through some antidotes.
We organize all of the trending information in your field so you don't have to. Join 42,000+ users and stay up to date on the latest articles your peers are reading.
You know about us, now we want to get to know you!
Let's personalize your content
Let's get even more personalized
We recognize your account from another site in our network, please click 'Send Email' below to continue with verifying your account and setting a password.


Let's personalize your content