This site uses cookies to improve your experience. To help us insure we adhere to various privacy regulations, please select your country/region of residence. If you do not select a country, we will assume you are from the United States. Select your Cookie Settings or view our Privacy Policy and Terms of Use.
Cookie Settings
Cookies and similar technologies are used on this website for proper function of the website, for tracking performance analytics and for marketing purposes. We and some of our third-party providers may use cookie data for various purposes. Please review the cookie settings below and choose your preference.
Used for the proper function of the website
Used for monitoring website traffic and interactions
Cookie Settings
Cookies and similar technologies are used on this website for proper function of the website, for tracking performance analytics and for marketing purposes. We and some of our third-party providers may use cookie data for various purposes. Please review the cookie settings below and choose your preference.
Strictly Necessary: Used for the proper function of the website
Performance/Analytics: Used for monitoring website traffic and interactions
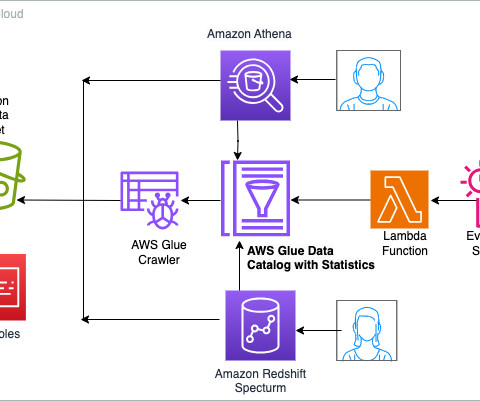
Today, we’re making available a new capability of AWS Glue Data Catalog that allows generating column-level statistics for AWS Glue tables. These statistics are now integrated with the cost-based optimizers (CBO) of Amazon Athena and Amazon Redshift Spectrum , resulting in improved query performance and potential cost savings.
This post is a primer on the delightful world of testing and experimentation (A/B, Multivariate, and a new term from me: Experience Testing). Experimentation and testing help us figure out we are wrong, quickly and repeatedly and if you think about it that is a great thing for our customers, and for our employers.
In addition to newer innovations, the practice borrows from model risk management, traditional model diagnostics, and software testing. Security vulnerabilities : adversarial actors can compromise the confidentiality, integrity, or availability of an ML model or the data associated with the model, creating a host of undesirable outcomes.
We’ve gathered some interesting data security statistics to give you insight into industry trends, help you determine your own security posture (at least relative to peers), and offer data points to help you advocate for cloud-native data security in your own organization.
But often that’s how we present statistics: we just show the notes, we don’t play the music.” – Hans Rosling, Swedish statistician. Your Chance: Want to test a powerful data visualization software? 14) “Visualize This: The Flowing Data Guide to Design, Visualization, and Statistics” by Nathan Yau. click for book source**.
You can use the flexible connector framework and search flow pipelines in OpenSearch to connect to models hosted by DeepSeek, Cohere, and OpenAI, as well as models hosted on Amazon Bedrock and SageMaker. Python The code has been tested with Python version 3.13. Execute that command before running the next script.
But there’s a host of new challenges when it comes to managing AI projects: more unknowns, non-deterministic outcomes, new infrastructures, new processes and new tools. This has serious implications for software testing, versioning, deployment, and other core development processes. Machine learning adds uncertainty.
Also, explore our guide to KPI management and learn from a host of helpful best practices. The financial loss and profit dashboard hones in on gross profit margin, OPEX ratio, operating profit margin, and net profit margin, offering a host of bespoke information at your fingertips. Quick Ratio / Acid Test. click to enlarge**.
The data science path you ultimately choose will depend on your skillset and interests, but each career path will require some level of programming, data visualization, statistics, and machine learning knowledge and skills. On-site courses are available in Munich. Remote courses are also available. Switchup rating: 5.0 (out Cost: $1,099.
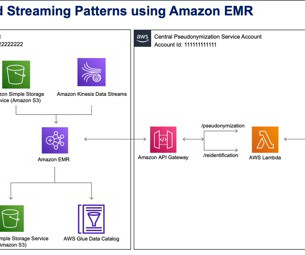
The account on the right hosts the pseudonymization service, which you can deploy using the instructions provided in the Part 1 of this series. Batch deployment steps As described in the prerequisites, before you deploy the solution, upload the Parquet files of the test dataset to Amazon S3. deployment_scripts/deploy_1.sh
Others aim simply to manage the collection and integration of data, leaving the analysis and presentation work to other tools that specialize in data science and statistics. Its cloud-hosted tool manages customer communications to deliver the right messages at times when they can be absorbed. Of course, marketing also works.
According to the statistics portal Statista , there are currently around 4.78 Design for ‘bigger fingers’: With mobile platforms especially, people will use their fingers to interact with your dashboards – and of course, peoples’ fingers come in a host of shapes and sizes. We live in a mobile world. Sales mobile dashboard example.
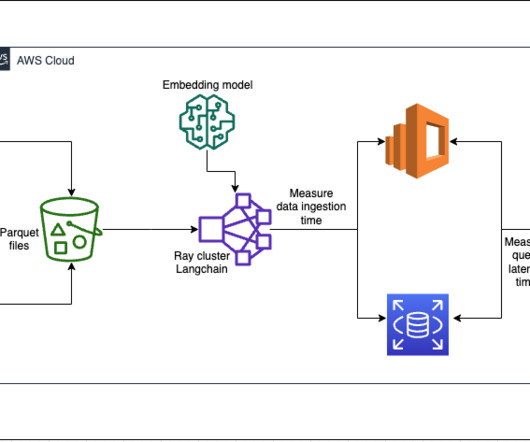
Ray cluster for ingestion and creating vector embeddings In our testing, we found that the GPUs make the biggest impact to performance when creating the embeddings. After you review the cluster configuration, select the jump host as the target for the run command. zst`; do zstd -d $F; done rm *.zst
4) How to Select Your KPIs 5) Avoid These KPI Mistakes 6) How To Choose A KPI Management Solution 7) KPI Management Examples Fact: 100% of statistics strategically placed at the top of blog posts are a direct result of people studying the dynamics of Key Performance Indicators, or KPIs. 3) What Are KPI Best Practices?
This blog also provides code examples with a Jupyter notebook that you can download or run via hosting provided by Domino. Beginning their analytical strategy with a data type abstraction allowed the Uber engineering team to better integrate deep learning best practices for model training, validation, testing and deployment.
For example, imagine a fantasy football site is considering displaying advanced player statistics. A ramp-up strategy may mitigate the risk of upsetting the site’s loyal users who perhaps have strong preferences for the current statistics that are shown. Here, day-of-week is a time-based confounder.
Each service is hosted in a dedicated AWS account and is built and maintained by a product owner and a development team, as illustrated in the following figure. This separation means changes can be tested thoroughly before being deployed to live operations. The overall structure can be represented in the following figure.
Most commonly, we think of data as numbers that show information such as sales figures, marketing data, payroll totals, financial statistics, and other data that can be counted and measured objectively. All descriptive statistics can be calculated using quantitative data. It’s generated by a host of sources in different ways.
It involves: Reviewing data in detail Comparing and contrasting the data to its own metadata Running statistical models Data quality reports. Also known as data validation, integrity refers to the structural testing of data to ensure that the data complies with procedures. Your Chance: Want to test a professional analytics software?
A 1958 Harvard Business Review article coined the term information technology, focusing their definition on rapidly processing large amounts of information, using statistical and mathematical methods in decision-making, and simulating higher order thinking through applications. What comes first: A new brand or operating model?
Whitehall has expressed a desire to move to a buy once, use many times approach to technology as well as ensuring that nationally important systems are resilience tested annually. One Login would replace the 180 different accounts and 44 different sign-on methods you would theoretically need to access all government services. .
These sources include ad marketplaces that dump statistics about audience engagement and click-through rates, sales software systems that report on customer purchases, and websites — and even storeroom floors — that track engagement. Survey CTO One common way to test market sentiment is to gather information directly from customers.
Choose Test connection to verify that AWS SCT can connect to your source Azure Synapse project. Choose Test connection to verify that AWS SCT can connect to your target Redshift workgroup. When the test is successful, choose OK. to indicate local host. Choose Test connection. Choose Test Task.
Thorough testing and performance optimization will facilitate a smooth transition with minimal disruption to end-users, fostering exceptional user experiences and satisfaction. Depending on each migration wave and what is being done in the wave (development, testing, or performance tuning), the right people will be engaged.
2) Charts And Graphs Categories 3) 20 Different Types Of Graphs And Charts 4) How To Choose The Right Chart Type Data and statistics are all around us. That said, there is still a lack of charting literacy due to the wide range of visuals available to us and the misuse of statistics. Table of Contents 1) What Are Graphs And Charts?
Follow along In the following examples, we often refer to two out-of-the-box sample topics, Product Sales and Student Enrollment Statistics , so you can follow along as you go. For example, in the student enrollment statistics example, Q already set Home of Origin as Location so if someone asks “where,” Q knows to use this field (Figure 6).
This includes fulfillment providers, CDN, networking and infrastructure, hosting providers (as applicable), security team leadership, payment processors, media asset delivery providers, call centers, monitoring teams, application support teams, application vendor and product teams, marketing and merchandising teams, etc.
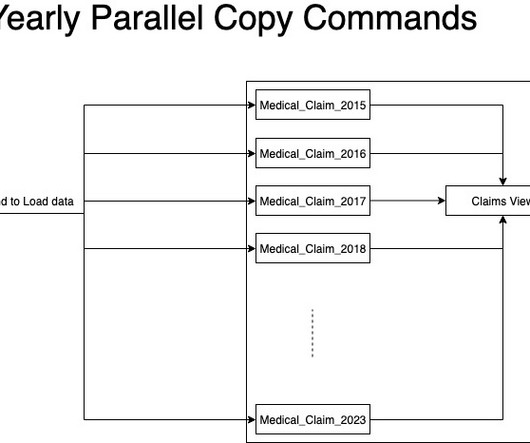
The 3-node RA3 16XL provisioned cluster that had previously been hosting their warehouse was taking around 12 hours to ingest this data to Amazon Redshift , and Gilead was looking to optimize the data ingestion process in a more dynamic manner. This data volume is expected to increase monthly and is fully refreshed each month.
This requires coordination across multiple teams to get all of these applied and tested within the various environments, so don’t leave it to the last minute. What about external penetration testing for potential threats and vulnerabilities? And if they are, plan extra time for testing. Performance testing & tuning.
Areas making up the data science field include mining, statistics, data analytics, data modeling, machine learning modeling and programming. Ultimately, data science is used in defining new business problems that machine learning techniques and statistical analysis can then help solve.
One of the key challenges in distributed scale-out databases included how to deploy many hosts built with high availability and elasticity while keeping the familiar SQL interface. We were excited to see our TPC benchmarking results and additional benchmarking tests. Co-developing with customers in gaming, banking and ridesharing.
These methods provided the benefit of being supported by rich literature on the relevant statisticaltests to confirm the model’s validity—if a validator wanted to confirm that the input predictors of a regression model were indeed relevant to the response, they need only to construct a hypothesis test to validate the input.
LLMs like ChatGPT are trained on massive amounts of text data, allowing them to recognize patterns and statistical relationships within language. The majority (72%) of enterprises that use APIs for model access use models hosted on their cloud service providers. Example : A patient visits a doctor with concerning symptoms.
For instance, if you’re offering a free test or trial of a product or service online, you’ll be able to capture NPS-based data and understand how to evolve your offerings to better meet the needs of your consumers. We see our customers as invited guests to a party, and we are the hosts. Primary KPIs: Top Agents. Utilization Rate.
Risk management To make underwriting decisions related to property, insurance companies gather a significant amount of external data, including the property data provided in insurance application forms, historical records of floods, hurricanes, fire incidents and crime statistics for the specific location of the property.
I’m your host for the day, Janci Rani, and I’m here representing people who are thriving to enter the domain of data science. The only thing is, you know, I understand what we do understand that, you know, using statistics using coding and everything, we will do amazing stuff. So I asked him one.
In conversation with reporter Cade Metz, who broke the story, on the New York Times podcast The Daily , host Michael Barbaro called copyright violation “ AI’s Original Sin.” During training, the AI model learns the statistical relationships between the words or images in its training set. We need to achieve both goals.
On January 4th I had the pleasure of hosting a webinar. Storytelling is a nice one to use early on to test the approach. But we are seeing increasing data suggesting that broad and bland data literacy programs, for example statistics certifying all employees of a firm, do not actually lead to the desired change. Yes, and no.
And last is the probabilistic nature of statistics and machine learning (ML). Because statistics: Last is the inherently probabilistic nature of ML. Materiality is a widely used concept in the world of model risk management , a regulatory field that governs how financial institutions document, test, and monitor the models they deploy.
Your Chance: Want to test a professional data discovery tool for free? Your Chance: Want to test a professional data discovery tool for free? While every organization is inherently different and one size certainly doesn’t fit all, there are a host of pain points that often cross over from one organization to another.
At CMU I joined a panel hosted by Zachary Lipton where someone in the audience asked a question about machine learning model interpretation. They also require advanced skills in statistics, experimental design, causal inference, and so on – more than most data science teams will have. Let’s look through some antidotes.
I mean developing and inserting a subtle collection of gentle nudges that can help increase the conversion rate by a statistically significant amount. Social cues (/proof) can help create a sense of urgency for a whole host of companies. Such is the case with A/B testing. I don’t mean: BUY IT NOW OR ELSE! Sizing the Opportunity.
Your deep understanding of statistics etc is not required. Some companies have inhouse (hosted) solutions (javascript tag based or log file based). Understanding ecosystem. Business strategy. Trinity type execution of measurement. Smooth talker (sorry, "effective communicator") etc. Javascript hacking skills are optional.
He advocated that an impactful ML solution does not end with Google Slides but becomes “a working API that is hosted or a GUI or some piece of working code that people can put to work” Wiggins also dove into examples of applying unsupervised, supervised, and reinforcement learning to address business problems. And we can do that.
We organize all of the trending information in your field so you don't have to. Join 42,000+ users and stay up to date on the latest articles your peers are reading.
You know about us, now we want to get to know you!
Let's personalize your content
Let's get even more personalized
We recognize your account from another site in our network, please click 'Send Email' below to continue with verifying your account and setting a password.


Let's personalize your content