

The Race For Data Quality in a Medallion Architecture
DataKitchen
NOVEMBER 5, 2024
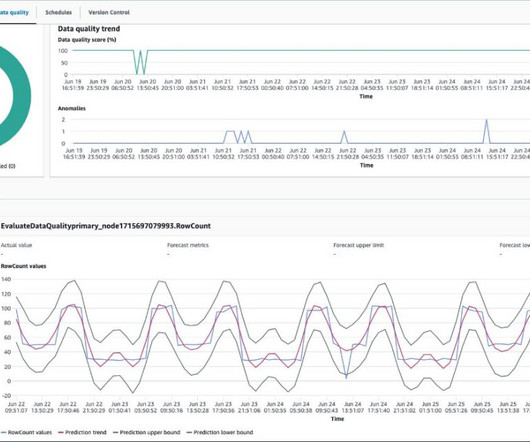
The Race For Data Quality In A Medallion Architecture The Medallion architecture pattern is gaining traction among data teams. It is a layered approach to managing and transforming data. It sounds great, but how do you prove the data is correct at each layer? How do you ensure data quality in every layer ?


Let's personalize your content