This site uses cookies to improve your experience. To help us insure we adhere to various privacy regulations, please select your country/region of residence. If you do not select a country, we will assume you are from the United States. Select your Cookie Settings or view our Privacy Policy and Terms of Use.
Cookie Settings
Cookies and similar technologies are used on this website for proper function of the website, for tracking performance analytics and for marketing purposes. We and some of our third-party providers may use cookie data for various purposes. Please review the cookie settings below and choose your preference.
Used for the proper function of the website
Used for monitoring website traffic and interactions
Cookie Settings
Cookies and similar technologies are used on this website for proper function of the website, for tracking performance analytics and for marketing purposes. We and some of our third-party providers may use cookie data for various purposes. Please review the cookie settings below and choose your preference.
Strictly Necessary: Used for the proper function of the website
Performance/Analytics: Used for monitoring website traffic and interactions
1) What Is DataQuality Management? 4) DataQuality Best Practices. 5) How Do You MeasureDataQuality? 6) DataQuality Metrics Examples. 7) DataQuality Control: Use Case. 8) The Consequences Of Bad DataQuality. 9) 3 Sources Of Low-QualityData.
In recent years, data lakes have become a mainstream architecture, and dataquality validation is a critical factor to improve the reusability and consistency of the data. In this post, we provide benchmark results of running increasingly complex dataquality rulesets over a predefined test dataset.
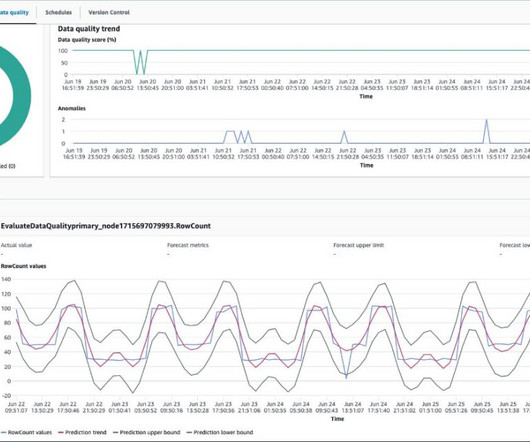
AWS Glue DataQuality allows you to measure and monitor the quality of data in your data repositories. It’s important for business users to be able to see quality scores and metrics to make confident business decisions and debug dataquality issues.
Data exploded and became big. Spreadsheets finally took a backseat to actionable and insightful datavisualizations and interactive business dashboards. The rise of self-service analytics democratized the data product chain. 1) DataQuality Management (DQM). We all gained access to the cloud.
They establish dataquality rules to ensure the extracted data is of high quality for accurate business decisions. These rules commonly assess the data based on fixed criteria reflecting the current business state. In this post, we demonstrate how this feature works with an example.
The process of collecting, processing and integrating data from various sources to ensure the digital twin mirrors the physical entity accurately. AI and machine learning models that analyze data and simulate scenarios to predict future behaviors and outcomes. Visualization. Ensure dataquality.
Today, we are pleased to announce that Amazon DataZone is now able to present dataquality information for data assets. Other organizations monitor the quality of their data through third-party solutions. Additionally, Amazon DataZone now offers APIs for importing dataquality scores from external systems.
The essential element in this step is to be able to answer in what way your company or organization makes business decisions, and how the quality of these decisions is measured. Implement your BI solution and measure success. Maximum security and data privacy. Clear the clutter and define a timeframe.
This can include a multitude of processes, like data profiling, dataquality management, or data cleaning, but we will focus on tips and questions to ask when analyzing data to gain the most cost-effective solution for an effective business strategy. 3) Where will your data come from?
By implementing the right reporting tools and understanding how to analyze as well as to measure your data accurately, you will be able to make the kind of data driven decisions that will drive your business forward. What Is Data Driven Decision Making? Quantitative data analysis focuses on numbers and statistics.
They establish dataquality rules to ensure the extracted data is of high quality for accurate business decisions. These rules assess the data based on fixed criteria reflecting current business states. We are excited to talk about how to use dynamic rules , a new capability of AWS Glue DataQuality.
We are excited to announce the General Availability of AWS Glue DataQuality. Our journey started by working backward from our customers who create, manage, and operate data lakes and data warehouses for analytics and machine learning. It takes days for data engineers to identify and implement dataquality rules.
Some customers build custom in-house data parity frameworks to validate data during migration. Others use open source dataquality products for data parity use cases. This takes away important person hours from the actual migration effort into building and maintaining a data parity framework.
DataOps needs a directed graph-based workflow that contains all the data access, integration, model and visualization steps in the data analytic production process. It orchestrates complex pipelines, toolchains, and tests across teams, locations, and data centers. OwlDQ — Predictive dataquality.
If the data is not easily gathered, managed and analyzed, it can overwhelm and complicate decision-makers. Data insight techniques provide a comprehensive set of tools, data analysis and quality assurance features to allow users to identify errors, enhance dataquality, and boost productivity.’
The data-driven world doesn’t have to be overwhelming, and with the right BI tools , the entire process can be easily managed with a few clicks. One additional element to consider is visualizingdata. This kind of report will become visual, easily accessed, and steadfast in gathering insights. click to enlarge**.
The new data frontier: AI and DaaS Emmelibri uses data as a source of business, and a visualization tool like Tableau can be an important organizational choice, says Paleari. An innovation for CIOs: measuring IT with KPIs CIOs discuss sales targets with CEOs and the board, cementing the IT and business bond.
However, it is often unclear where the data needed for reporting is stored and what quality it is in. Often the dataquality is insufficient to make reliable statements. Insufficient or incorrect data can even lead to wrong decisions, says Kastrati. Big data and analytics provide valuable support in this regard.
Poor-qualitydata can lead to incorrect insights, bad decisions, and lost opportunities. AWS Glue DataQualitymeasures and monitors the quality of your dataset. It supports both dataquality at rest and dataquality in AWS Glue extract, transform, and load (ETL) pipelines.
Data consumers lose trust in data if it isn’t accurate and recent, making dataquality essential for undertaking optimal and correct decisions. Evaluation of the accuracy and freshness of data is a common task for engineers. Currently, various tools are available to evaluate dataquality.
A robust process checks source data and work-in-progress at each processing step along the way to polished visualizations, charts, and graphs. Figure 1: The process of transforming raw data into actionable business intelligence is a manufacturing process. Week after week, it is measured with a million rows.
These layers help teams delineate different stages of data processing, storage, and access, offering a structured approach to data management. In the context of Data in Place, validating dataquality automatically with Business Domain Tests is imperative for ensuring the trustworthiness of your data assets.
These tools allow for a wide range of users to easily connect to, interact with, visualize and communicate their data. Easy drag and drop interfaces require little training and no prior data analysis or SQL skills. 4) Businesses aren’t measuring the right indicators. 7) Dealing with the impact of poor dataquality.
In addition to real-time analytics and visualization, the data needs to be shared for long-term data analytics and machine learning applications. The data science and AI teams are able to explore and use new data sources as they become available through Amazon DataZone.
How Can I Ensure DataQuality and Gain Data Insight Using Augmented Analytics? There are many business issues surrounding the use of data to make decisions. One such issue is the inability of an organization to gather and analyze data.
This includes defining the main stakeholders, assessing the situation, defining the goals, and finding the KPIs that will measure your efforts to achieve these goals. A planned BI strategy will point your business in the right direction to meet its goals by making strategic decisions based on real-time data. It’s that simple.
When we talk about data integrity, we’re referring to the overarching completeness, accuracy, consistency, accessibility, and security of an organization’s data. Together, these factors determine the reliability of the organization’s data. DataqualityDataquality is essentially the measure of data integrity.
This gives to that sales graph an overall sense of visual contrast which makes it much more digestible at a glance. A perfect example of how to present sales data, this profit-boosting sales chart offers a panoramic snapshot of your agents’ overall upselling and cross-selling efforts based on revenue and performance.
Partial dependence, accumulated local effect (ALE), and individual conditional expectation (ICE) plots : this involves systematically visualizing the effects of changing one or more variables in your model. 8] , [12] Again, traditional model assessment measures don’t tell us much about whether a model is secure.
By understanding your core business goals and selecting the right key performance indicator ( KPI ) and metrics for your specific needs, you can use an information technology report sample to visualize your most valuable data at a glance, developing initiatives and making pivotal decisions swiftly and with confidence.
A SaaS dashboard consolidates and visualizes critical SaaS metrics, covering sales, marketing, finance, consumer support, management, and development to offer an unobstructed panoramic view of the SaaS business and achieve better business performance and profit. Dataquality , speed, and consistency in one neat package. .
Because things are changing and becoming more competitive in every sector of business, the benefits of business intelligence and proper use of data analytics are key to outperforming the competition. BI software uses algorithms to extract actionable insights from a company’s data and guide its strategic decisions. The results?
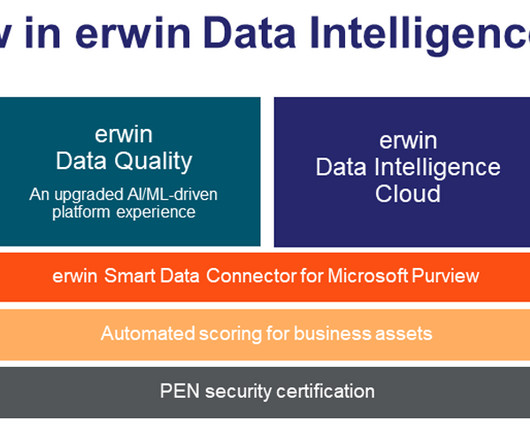
Added dataquality capability ready for an AI era Dataquality has never been more important than as we head into this next AI-focused era. erwin DataQuality is the dataquality heart of erwin Data Intelligence. erwin DataQuality is the dataquality heart of erwin Data Intelligence.
Defined as quantifiable and objective behavioral and physiological data collected and measured by digital devices such as implantables, wearables, ingestibles, or portables, digital biomarkers enable pharmaceutical companies to conduct studies remotely without the need for a physical site.
Web and application developers rely on synthetic monitoring that simulate user interactions at scale to measure performance and availability for different scenarios, locations, and devices instead of waiting for real users to hit problem areas or to test new apps and features before launch.
Getting the technology right can be challenging but building the right team with the right skills to undertake data initiatives can be even harder — a challenge reflected in the rising demand for big data and analytics skills and certifications. The number of data analytics certs is expanding rapidly.
Traditional spreadsheets no longer serve their purpose, there is just too much data to store, manage and analyze. Be it in the form of online BI tools , or an online datavisualization system, a company must address where and how to store its data. Cost management and containment.
The Business Application Research Center (BARC) warns that data governance is a highly complex, ongoing program, not a “big bang initiative,” and it runs the risk of participants losing trust and interest over time. Informatica Axon Informatica Axon is a collection hub and data marketplace for supporting programs.
The focus here should be on considering all ways your customers currently consume data as well as new ways they might want to achieve better results. So much, in fact, that it’s worth measuring what percentage of your portfolio utilizes data and analytics as part of the offering, and tracking this over time.
An effective DataOps observability solution requires supporting infrastructure for the journeys to observe and report what’s happening across your data estate. Logs and storage for problem diagnosis and visualization of historical trends. Data and tool tests. Storing Run Data for Analysis. An event or rules engine.
Download right here your quick summary of the customers’ data world! The ability to visualize real-time market changes. Customer data is a state of constant flux, which is the number one reason to employ solid data monitoring principles. Visualize your data. Adopting a CI-driven mindset is essential.
Val Logan of The Data Lodge is one of the premier thinkers on how organizations can build shared skills in using data. If you are going to lean on data, you want to understand its quality. Here’s an overview article from Neil Patel about assessing dataquality.
It’s necessary to say that these processes are recurrent and require continuous evolution of reports, online datavisualization , dashboards, and new functionalities to adapt current processes and develop new ones. Testing will eliminate lots of dataquality challenges and bring a test-first approach through your agile cycle.
A few years ago, Gartner found that “organizations estimate the average cost of poor dataquality at $12.8 million per year.’” Beyond lost revenue, dataquality issues can also result in wasted resources and a damaged reputation. Data management defined You may be wondering what data management means.
We organize all of the trending information in your field so you don't have to. Join 42,000+ users and stay up to date on the latest articles your peers are reading.
You know about us, now we want to get to know you!
Let's personalize your content
Let's get even more personalized
We recognize your account from another site in our network, please click 'Send Email' below to continue with verifying your account and setting a password.


Let's personalize your content