This site uses cookies to improve your experience. To help us insure we adhere to various privacy regulations, please select your country/region of residence. If you do not select a country, we will assume you are from the United States. Select your Cookie Settings or view our Privacy Policy and Terms of Use.
Cookie Settings
Cookies and similar technologies are used on this website for proper function of the website, for tracking performance analytics and for marketing purposes. We and some of our third-party providers may use cookie data for various purposes. Please review the cookie settings below and choose your preference.
Used for the proper function of the website
Used for monitoring website traffic and interactions
Cookie Settings
Cookies and similar technologies are used on this website for proper function of the website, for tracking performance analytics and for marketing purposes. We and some of our third-party providers may use cookie data for various purposes. Please review the cookie settings below and choose your preference.
Strictly Necessary: Used for the proper function of the website
Performance/Analytics: Used for monitoring website traffic and interactions
Announcing DataOps DataQuality TestGen 3.0: Open-Source, Generative DataQuality Software. It assesses your data, deploys production testing, monitors progress, and helps you build a constituency within your company for lasting change. New Quality Dashboard & Score Explorer.
1) What Is DataQuality Management? 4) DataQuality Best Practices. 5) How Do You Measure DataQuality? 6) DataQuality Metrics Examples. 7) DataQuality Control: Use Case. 8) The Consequences Of Bad DataQuality. 9) 3 Sources Of Low-QualityData.
As technology and business leaders, your strategic initiatives, from AI-powered decision-making to predictive insights and personalized experiences, are all fueled by data. Yet, despite growing investments in advanced analytics and AI, organizations continue to grapple with a persistent and often underestimated challenge: poor dataquality.
Once the province of the data warehouse team, data management has increasingly become a C-suite priority, with dataquality seen as key for both customer experience and business performance. But along with siloed data and compliance concerns , poor dataquality is holding back enterprise AI projects.
Metadata management is key to wringing all the value possible from data assets. However, most organizations don’t use all the data at their disposal to reach deeper conclusions about how to drive revenue, achieve regulatory compliance or accomplish other strategic objectives. What Is Metadata? Harvest data.
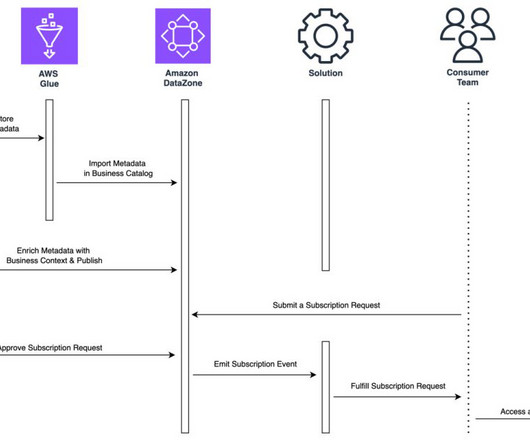
Today, we are pleased to announce that Amazon DataZone is now able to present dataquality information for data assets. Other organizations monitor the quality of their data through third-party solutions. Additionally, Amazon DataZone now offers APIs for importing dataquality scores from external systems.
A catalog or a database that lists models, including when they were tested, trained, and deployed. A catalog of validation data sets and the accuracy measurements of stored models. Versioning (of models, feature vectors , data) and the ability to roll out, roll back, or have multiple live versions.
Know thy data: understand what it is (formats, types, sampling, who, what, when, where, why), encourage the use of data across the enterprise, and enrich your datasets with searchable (semantic and content-based) metadata (labels, annotations, tags). Test early and often. Test and refine the chatbot.
have a large body of tools to choose from: IDEs, CI/CD tools, automated testing tools, and so on. are only starting to exist; one big task over the next two years is developing the IDEs for machine learning, plus other tools for data management, pipeline management, data cleaning, data provenance, and data lineage.
In the context of Data in Place, validating dataquality automatically with Business Domain Tests is imperative for ensuring the trustworthiness of your data assets. Running these automated tests as part of your DataOps and Data Observability strategy allows for early detection of discrepancies or errors.
Some customers build custom in-house data parity frameworks to validate data during migration. Others use open source dataquality products for data parity use cases. This takes away important person hours from the actual migration effort into building and maintaining a data parity framework.
The data engineer then emails the BI Team, who refreshes a Tableau dashboard. Figure 1: Example data pipeline with manual processes. There are no automated tests , so errors frequently pass through the pipeline. The pipeline has automated tests at each step, making sure that each step completes successfully.
The purpose of this article is to provide a model to conduct a self-assessment of your organization’s data environment when preparing to build your Data Governance program. Take the […].
Data Pipeline Observability: Optimizes pipelines by monitoring dataquality, detecting issues, tracing data lineage, and identifying anomalies using live and historical metadata. This capability includes monitoring, logging, and business-rule detection.
If you are not observing and reacting to the data, the model will accept every variant and it may end up one of the more than 50% of models, according to Gartner , that never make it to production because there are no clear insights and the results have nothing to do with the original intent of the model.
If you’ve been following DataKitchen at all, you know we are all about transferring software development methods to data analytics. . The organizational concepts behind data mesh are summarized as follows. A five to nine-person team owns the dev, test, deployment, monitoring and maintenance of a domain.
The Business Application Research Center (BARC) warns that data governance is a highly complex, ongoing program, not a “big bang initiative,” and it runs the risk of participants losing trust and interest over time. The program must introduce and support standardization of enterprise data.
Alation and Soda are excited to announce a new partnership, which will bring powerful data-quality capabilities into the data catalog. Soda’s data observability platform empowers data teams to discover and collaboratively resolve data issues quickly. Do we have end-to-end data pipeline control?
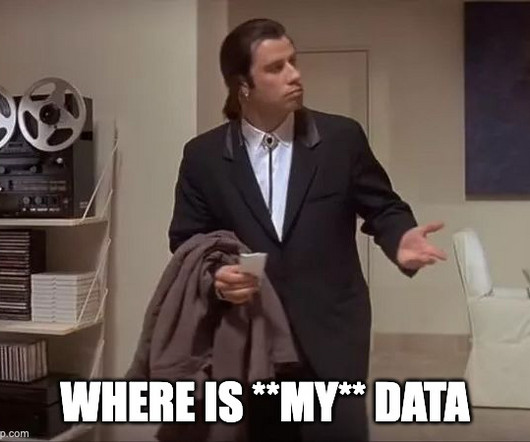
Deploying a Data Journey Instance unique to each customer’s payload is vital to fill this gap. Such an instance answers the critical question of ‘Dude, Where is my data?’ ’ while maintaining operational efficiency and ensuring dataquality—thus preserving customer satisfaction and the team’s credibility.
In the above case of merging information about companies from different data sources, data linking helps us encode the real-world business logic into data linking rules. But, before we can have any larger scale implementation of these rules, we have to test their validity. How does the Gold Standard help data linking?
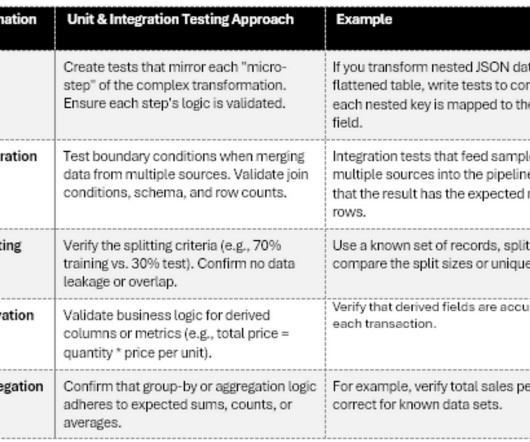
In this post, well see the fundamental procedures, tools, and techniques that data engineers, data scientists, and QA/testing teams use to ensure high-qualitydata as soon as its deployed. First, we look at how unit and integration tests uncover transformation errors at an early stage. PyTest, JUnit,NUnit).
Metadata enrichment is about scaling the onboarding of new data into a governed data landscape by taking data and applying the appropriate business terms, data classes and quality assessments so it can be discovered, governed and utilized effectively. Scalability and elasticity.
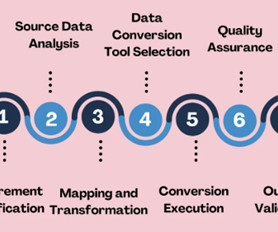
Introduction Data transformations and data conversions are crucial to ensure that raw data is organized, processed, and ready for useful analysis. However, these two processes are essentially distinct, and their testing needs differ in manyways.
Manually upgrading, testing, and deploying over 5,000 jobs every few quarters was time consuming, error prone, costly, and not sustainable. EDLS job steps and metadata Every EDLS job comprises one or more job steps chained together and run in a predefined order orchestrated by the custom ETL framework.
Automated data enrichment : To create the knowledge catalog, you need automated data stewardship services. These services include the ability to auto-discover and classify data, to detect sensitive information, to analyze dataquality, to link business terms to technical metadata and to publish data to the knowledge catalog.
A data catalog benefits organizations in a myriad of ways. With the right data catalog tool, organizations can automate enterprise metadata management – including data cataloging, data mapping, dataquality and code generation for faster time to value and greater accuracy for data movement and/or deployment projects.
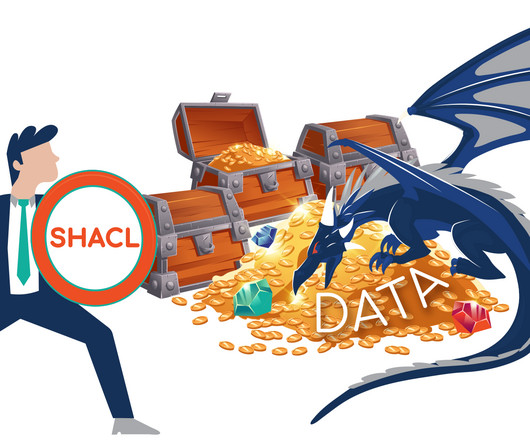
While everyone may subscribe to the same design decisions and agree on an ontology, there may be differences in the dataquality. In such situations, data must be validated. Let’s build a very simple test dataset. For our test set, we can simply use sh:path. Instead, they provide metadata about the shapes.
In the modern data stack, dbt is a key tool to make data ready for analysis. Data analysts and engineers use dbt to transform, test, and document data in the cloud data warehouse. Yet every dbt transformation contains vital metadata that is not captured – until now. Conclusion.
The model outputs produced by the same code will vary with changes to things like the size of the training data (number of labeled examples), network training parameters, and training run time. This has serious implications for software testing, versioning, deployment, and other core development processes.
DataOps is an approach to best practices for data management that increases the quantity of data analytics products a data team can develop and deploy in a given time while drastically improving the level of dataquality. SPC is the continuous testing of the results of automated manufacturing processes.
Figure 1: Flow of actions for self-service analytics around data assets stored in relational databases First, the data producer needs to capture and catalog the technical metadata of the data asset. The producer also needs to manage and publish the data asset so it’s discoverable throughout the organization.
The companies that are most successful at marketing in both B2C and B2B are using data and online BI tools to craft hyper-specific campaigns that reach out to targeted prospects with a curated message. Everything is being tested, and then the campaigns that succeed get more money put into them, while the others aren’t repeated.
This also includes building an industry standard integrated data repository as a single source of truth, operational reporting through real time metrics, dataquality monitoring, 24/7 helpdesk, and revenue forecasting through financial projections and supply availability projections.
The Art of Service recommends candidates spend a minimum of 18 hours on the course to pass the certification test. It consists of three separate, 90-minute exams: the Information Systems (IS) Core exam, the Data Management Core exam, and the Specialty exam. How to prepare: The fee includes an online training program and PDF textbook.
With in-place table migration, you can rapidly convert to Iceberg tables since there is no need to regenerate data files. Only metadata will be regenerated. Newly generated metadata will then point to source data files as illustrated in the diagram below. . Dataquality using table rollback.
Bergh added, “ DataOps is part of the data fabric. You should use DataOps principles to build and iterate and continuously improve your Data Fabric. Automate the data collection and cleansing process. Education is the Biggest Challenge. Take a show-me approach.
“Most enterprise data is unstructured and semi-structured documents and code, as well as images and video. For example, gen AI can be used to extract metadata from documents, create indexes of information and knowledge graphs, and to query, summarize, and analyze this data. But sometimes there isn’t enough data,” says Thurai.
To ensure the stability of the US financial system, the implementation of advanced liquidity risk models and stress testing using (MI/AI) could potentially serve as a protective measure. However, because most institutions lack a modern data architecture , they struggle to manage, integrate and analyze financial data at pace.
They make testing and learning a part of that process. Using this methodology, teams will test new processes, monitor performance, and adjust based on results. In an approach based on continuous improvement, organizations must identify key assets so their metadata can be ingested and analyzed. Monitor and Measure Curation.
The Data Fabric paradigm combines design principles and methodologies for building efficient, flexible and reliable data management ecosystems. Knowledge Graphs are the Warp and Weft of a Data Fabric. To implement any Data Fabric approach, it is essential to be able to understand the context of data.
Data has become an invaluable asset for businesses, offering critical insights to drive strategic decision-making and operational optimization. The business end-users were given a tool to discover data assets produced within the mesh and seamlessly self-serve on their data sharing needs.
What Is Data Intelligence? Data intelligence is a system to deliver trustworthy, reliable data. It includes intelligence about data, or metadata. IDC coined the term, stating, “data intelligence helps organizations answer six fundamental questions about data.” Yet finding data is just the beginning.
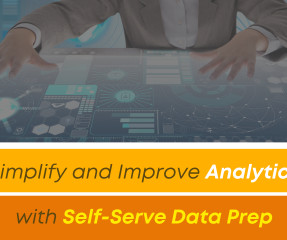
The right self-serve data prep solution can provide easy-to-use yet sophisticated data prep tools that are suitable for your business users, and enable data preparation techniques like: Connect and Mash Up Auto Suggesting Relationships JOINS and Types Sampling and Outliers Exploration, Cleaning, Shaping Reducing and Combining Data Insights (DataQuality (..)
How dbt Core aids data teams test, validate, and monitor complex data transformations and conversions Photo by NASA on Unsplash Introduction dbt Core, an open-source framework for developing, testing, and documenting SQL-based data transformations, has become a must-have tool for modern data teams as the complexity of data pipelines grows.
We organize all of the trending information in your field so you don't have to. Join 42,000+ users and stay up to date on the latest articles your peers are reading.
You know about us, now we want to get to know you!
Let's personalize your content
Let's get even more personalized
We recognize your account from another site in our network, please click 'Send Email' below to continue with verifying your account and setting a password.


Let's personalize your content