This site uses cookies to improve your experience. To help us insure we adhere to various privacy regulations, please select your country/region of residence. If you do not select a country, we will assume you are from the United States. Select your Cookie Settings or view our Privacy Policy and Terms of Use.
Cookie Settings
Cookies and similar technologies are used on this website for proper function of the website, for tracking performance analytics and for marketing purposes. We and some of our third-party providers may use cookie data for various purposes. Please review the cookie settings below and choose your preference.
Used for the proper function of the website
Used for monitoring website traffic and interactions
Cookie Settings
Cookies and similar technologies are used on this website for proper function of the website, for tracking performance analytics and for marketing purposes. We and some of our third-party providers may use cookie data for various purposes. Please review the cookie settings below and choose your preference.
Strictly Necessary: Used for the proper function of the website
Performance/Analytics: Used for monitoring website traffic and interactions
The Race For DataQuality In A Medallion Architecture The Medallion architecture pattern is gaining traction among data teams. It is a layered approach to managing and transforming data. It sounds great, but how do you prove the data is correct at each layer? How do you ensure dataquality in every layer ?
Is Your Team in Denial of DataQuality? Here’s How to Tell In many organizations, dataquality problems fester in the shadowsignored, rationalized, or swept aside with confident-sounding statements that mask a deeper dysfunction. That’s not testing; that’s wishful thinking. Is your team ready?
1) What Is DataQuality Management? 4) DataQuality Best Practices. 5) How Do You Measure DataQuality? 6) DataQualityMetrics Examples. 7) DataQuality Control: Use Case. 8) The Consequences Of Bad DataQuality. 9) 3 Sources Of Low-QualityData.
Data Observability and DataQualityTesting Certification Series We are excited to invite you to a free four-part webinar series that will elevate your understanding and skills in Data Observation and DataQualityTesting. Don’t miss this opportunity to transform your data practices.
We’ve identified two distinct types of data teams: process-centric and data-centric. Understanding this framework offers valuable insights into team efficiency, operational excellence, and dataquality. Process-centric data teams focus their energies predominantly on orchestrating and automating workflows.
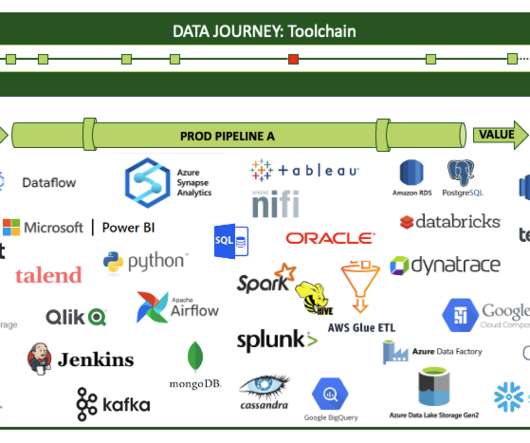
Testing and Data Observability. We have also included vendors for the specific use cases of ModelOps, MLOps, DataGovOps and DataSecOps which apply DataOps principles to machine learning, AI, data governance, and data security operations. . Genie — Distributed big data orchestration service by Netflix.
AWS Glue DataQuality allows you to measure and monitor the quality of data in your data repositories. It’s important for business users to be able to see quality scores and metrics to make confident business decisions and debug dataquality issues.
Today, we are pleased to announce that Amazon DataZone is now able to present dataquality information for data assets. Other organizations monitor the quality of their data through third-party solutions. Additionally, Amazon DataZone now offers APIs for importing dataquality scores from external systems.
Once the province of the data warehouse team, data management has increasingly become a C-suite priority, with dataquality seen as key for both customer experience and business performance. But along with siloed data and compliance concerns , poor dataquality is holding back enterprise AI projects.
Navigating the Storm: How Data Engineering Teams Can Overcome a DataQuality Crisis Ah, the dataquality crisis. It’s that moment when your carefully crafted data pipelines start spewing out numbers that make as much sense as a cat trying to bark. You’ve got yourself a recipe for data disaster.
In a previous post , we noted some key attributes that distinguish a machine learning project: Unlike traditional software where the goal is to meet a functional specification, in ML the goal is to optimize a metric. Quality depends not just on code, but also on data, tuning, regular updates, and retraining.
Data debt that undermines decision-making In Digital Trailblazer , I share a story of a private company that reported a profitable year to the board, only to return after the holiday to find that dataquality issues and calculation mistakes turned it into an unprofitable one.
In recent years, data lakes have become a mainstream architecture, and dataquality validation is a critical factor to improve the reusability and consistency of the data. In this post, we provide benchmark results of running increasingly complex dataquality rulesets over a predefined test dataset.
As technology and business leaders, your strategic initiatives, from AI-powered decision-making to predictive insights and personalized experiences, are all fueled by data. Yet, despite growing investments in advanced analytics and AI, organizations continue to grapple with a persistent and often underestimated challenge: poor dataquality.
Key Success Metrics, Benefits, and Results for Data Observability Using DataKitchen Software Lowering Serious Production Errors Key Benefit Errors in production can come from many sources – poor data, problems in the production process, being late, or infrastructure problems. Data errors can cause compliance risks.
Metrics should include system downtime and reliability, security incidents, incident response times, dataquality issues and system performance. Set goals and report metrics to determine if you are achieving the goals set out by the organization or the AI governance committee. version 0125). Its date is May 31st, 2025.
Some customers build custom in-house data parity frameworks to validate data during migration. Others use open source dataquality products for data parity use cases. This takes away important person hours from the actual migration effort into building and maintaining a data parity framework.
In Bringing an AI Product to Market , we distinguished the debugging phase of product development from pre-deployment evaluation and testing. During testing and evaluation, application performance is important, but not critical to success. require not only disclosure, but also monitored testing. Debugging AI Products.
So it’s Monday, and you lead a data analytics team of perhaps 30 people. But wait, she asks you for your team metrics. Like most leaders of data analytic teams, you have been doing very little to quantify your team’s success. Where is your metrics report? What should be in that report about your data team?
In the context of Data in Place, validating dataquality automatically with Business Domain Tests is imperative for ensuring the trustworthiness of your data assets. Moreover, advanced metrics like Percentage Regional Sales Growth can provide nuanced insights into business performance. What is Data in Use?
DataKitchen Training And Certification Offerings For Individual contributors with a background in Data Analytics/Science/Engineering Overall Ideas and Principles of DataOps DataOps Cookbook (200 page book over 30,000 readers, free): DataOps Certificatio n (3 hours, online, free, signup online): DataOps Manifesto (over 30,000 signatures) One (..)
Some will argue that observability is nothing more than testing and monitoring applications using tests, metrics, logs, and other artifacts. That’s a fair point, and it places emphasis on what is most important – what best practices should data teams employ to apply observability to data analytics.
Companies are no longer wondering if data visualizations improve analyses but what is the best way to tell each data-story. 2020 will be the year of dataquality management and data discovery: clean and secure data combined with a simple and powerful presentation. 1) DataQuality Management (DQM).
GSK had been pursuing DataOps capabilities such as automation, containerization, automated testing and monitoring, and reusability, for several years. At Workiva, they recognized that they are only as good as their data, so they centered their initial DataOps efforts around lowering errors. Multiple Metrics for Success.
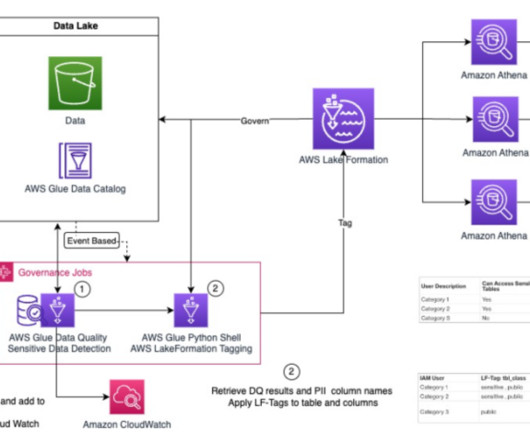
Due to the volume, velocity, and variety of data being ingested in data lakes, it can get challenging to develop and maintain policies and procedures to ensure data governance at scale for your data lake. Data confidentiality and dataquality are the two essential themes for data governance.
And when business users don’t complain, but you know the data isn’t good enough to make these types of calls wisely, that’s an even bigger problem. How are you, as a dataquality evangelist (if you’re reading this post, that must describe you at least somewhat, right?), Tie dataquality directly to business objectives.
Managers tend to incentivize activity metrics and measure inputs versus outputs,” she adds. Woolley recommends that companies consolidate around the minimum number of tools they need to get things done, and have a sandbox process to test and evaluate new tools that don’t get in the way of people doing actual work.
In addition to newer innovations, the practice borrows from model risk management, traditional model diagnostics, and software testing. It’s a very simple and powerful idea: simulate data that you find interesting and see what a model predicts for that data. 6] Debugging may focus on a variety of failure modes (i.e.,
The Third of Five Use Cases in Data Observability Data Evaluation: This involves evaluating and cleansing new datasets before being added to production. This process is critical as it ensures dataquality from the onset. Examples include regular loading of CRM data and anomaly detection.
Your Chance: Want to test an agile business intelligence solution? Business intelligence is moving away from the traditional engineering model: analysis, design, construction, testing, and implementation. Test BI in a small group and deploy the software internally. Finalize testing. Test throughout the lifecycle.
The model outputs produced by the same code will vary with changes to things like the size of the training data (number of labeled examples), network training parameters, and training run time. This has serious implications for software testing, versioning, deployment, and other core development processes.
Extrinsic Control Deficit: Many of these changes stem from tools and processes beyond the immediate control of the data team. Unregulated ETL/ELT Processes: The absence of stringent dataqualitytests in ETL (Extract, Transform, Load) or ELT (Extract, Load, Transform) processes further exacerbates the problem.
The data engineer then emails the BI Team, who refreshes a Tableau dashboard. Figure 1: Example data pipeline with manual processes. There are no automated tests , so errors frequently pass through the pipeline. The pipeline has automated tests at each step, making sure that each step completes successfully.
Now, with support for dbt Cloud, you can access a managed, cloud-based environment that automates and enhances your data transformation workflows. This upgrade allows you to build, test, and deploy data models in dbt with greater ease and efficiency, using all the features that dbt Cloud provides.
Photo by CDC on Unsplash Many data pipeline failures and quality issues that are detected by data observability tools in production could have been prevented earlier in the pipeline lifecycle with better pre-production testing strategies. Crucial for time-sensitive analytics and reporting processes.
Hopefully, with metrics in place, you can show measured improvements in productivity and quality that will win converts. Improve Collaboration, both Inter- and Intra -team – If the individuals in your data-analytics team don’t work together, it can impact analytics-cycle time, dataquality, governance, security and more.
How Artificial Intelligence is Impacting DataQuality. Artificial intelligence has the potential to combat human error by taking up the tasking responsibilities associated with the analysis, drilling, and dissection of large volumes of data. Dataquality is crucial in the age of artificial intelligence.
Webinar: Beyond Data Observability: Personalization DataKitchen DataOps Observability Problem Statement White Paper: ‘Taming Chaos’ Technical Product Overview Four-minute online demo Detailed Product: Documentation Webinar: Data Observability Demo Day DataKitchen DataOps TestGen Problem Statement White Paper: ‘Mystery Box Full Of Data Errors’ (..)
GE formed its Digital League to create a data culture. One of the keys for our success was really focusing that effort on what our key business initiatives were and what sorts of metrics mattered most to our customers. Chapin also mentioned that measuring cycle time and benchmarking metrics upfront was absolutely critical. “It
While sometimes it’s okay to follow your instincts, the vast majority of your business-based decisions should be backed by metrics, facts, or figures related to your aims, goals, or initiatives that can ensure a stable backbone to your management reports and business operations. In most cases, this can prove detrimental to the business.
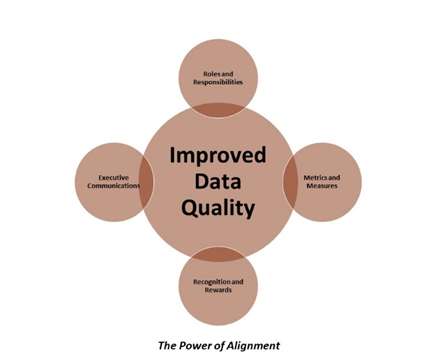
While this may seem like an odd question, understanding organizational change levers can help uncover opportunities for improving your data supply-chain processes. A key challenge with organizational alignment is communicating across all departments the goals, metrics, and benefits of a process or function.
As he thinks through the various journeys that data take in his company, Jason sees that his dashboard idea would require extracting or testing for events along the way. So, the only way for a data journey to truly observe what’s happening is to get his tools and pipelines to auto-report events. Data and tool tests.
The testing phase, particularly user acceptance testing (UAT), can become a labor-intensive bottleneck — and a budget breaker. According to a 2023 Capgemini report , companies spend about 35% of their IT budget on testing — a figure that has remained stubbornly high despite advancements in automation.
Another way to look at the five pillars is to see them in the context of a typical complex data estate. Monitoring is another pillar of Data Journeys, extending down the stack. The image above shows an example ‘’data at rest’ test result. For example, a test can check the top fifty customers or suppliers.
We organize all of the trending information in your field so you don't have to. Join 42,000+ users and stay up to date on the latest articles your peers are reading.
You know about us, now we want to get to know you!
Let's personalize your content
Let's get even more personalized
We recognize your account from another site in our network, please click 'Send Email' below to continue with verifying your account and setting a password.


Let's personalize your content