This site uses cookies to improve your experience. To help us insure we adhere to various privacy regulations, please select your country/region of residence. If you do not select a country, we will assume you are from the United States. Select your Cookie Settings or view our Privacy Policy and Terms of Use.
Cookie Settings
Cookies and similar technologies are used on this website for proper function of the website, for tracking performance analytics and for marketing purposes. We and some of our third-party providers may use cookie data for various purposes. Please review the cookie settings below and choose your preference.
Used for the proper function of the website
Used for monitoring website traffic and interactions
Cookie Settings
Cookies and similar technologies are used on this website for proper function of the website, for tracking performance analytics and for marketing purposes. We and some of our third-party providers may use cookie data for various purposes. Please review the cookie settings below and choose your preference.
Strictly Necessary: Used for the proper function of the website
Performance/Analytics: Used for monitoring website traffic and interactions
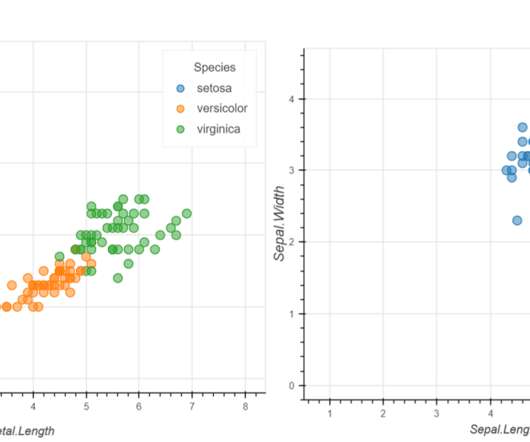
ArticleVideo Book This article was published as a part of the DataScience Blogathon Introduction In applied Statistics and Machine Learning, DataVisualization is one. The post Must Known DataVisualization Techniques for DataScience appeared first on Analytics Vidhya.
ArticleVideo Book This article was published as a part of the DataScience Blogathon DataVisualizationDataVisualization techniques involve the generation of graphical or. The post Effective DataVisualization Techniques in DataScience Using Python appeared first on Analytics Vidhya.
ArticleVideo Book This article was published as a part of the DataScience Blogathon Photo by fauxels from Pexels What is Exploratory Data Analysis? The post Exploratory Data Analysis and Visualization Techniques in DataScience appeared first on Analytics Vidhya. Exploratory.
ArticleVideo Book This article was published as a part of the DataScience Blogathon Introduction Plotting is essentially one of the most important steps in. The post Plotting Visualizations Out of Pandas DataFrames appeared first on Analytics Vidhya.
This article was published as a part of the DataScience Blogathon. Introduction With the advent of social media, a lot of data has been generated and is being generated. This data corresponds to either the opinion of people on political matters, on products they use, or on the services they use from companies.
ArticleVideo Book This article was published as a part of the DataScience Blogathon. What is datavisualization? ” The post A Complete Beginner’s Guide to DataVisualization appeared first on Analytics Vidhya. “A picture speaks a thousand words.”
This article was published as a part of the DataScience Blogathon. Introduction to Sankey Diagram for DataVisualization Very often, we are in a situation where we would have to visualize how data flows between entities.
This article was published as a part of the DataScience Blogathon. Introduction DataVisualization is used to present the insights in a given dataset. With meaningful and eye-catching charts, it becomes easier to communicate data analysis findings.
This article was published as a part of the DataScience Blogathon. The post Walmart’s Sales Analysis through DataVisualization appeared first on Analytics Vidhya. The post Walmart’s Sales Analysis through DataVisualization appeared first on Analytics Vidhya.
ArticleVideo Book This article was published as a part of the DataScience Blogathon Introduction Visualization leverages the power of data in getting insights and. The post Cyberpunk Themed Charts: Advanced DataVisualization in Python appeared first on Analytics Vidhya.
ArticleVideo Book This article was published as a part of the DataScience Blogathon Introduction Sometimes it is just convenient to leave the driving to. The post Uber and Lyft Cab Prices : Data Analysis and Visualization appeared first on Analytics Vidhya.
This article was published as a part of the DataScience Blogathon. The post Using DataVisualization to Explore the Human Space Race! The post Using DataVisualization to Explore the Human Space Race! Humankind has always looked up to the stars. We have seen signs and visions in celestial bodies.
This article was published as a part of the DataScience Blogathon. Overview of Parallel Coordinates Plot While using visualizations, one compact visualization showing the relation between multiple variables has an upper hand over multiple visualizations – one for each variable.
This article was published as a part of the DataScience Blogathon. Introduction Datavisualization is the skill that helps us to interpret the data in a creative and intrusive way. Suppose we break down more aspects of datavisualization.
ArticleVideo Book This article was published as a part of the DataScience Blogathon Introduction Matplotlib is a widely used library for datavisualizations. The post Exploring Matplotlib Stylesheets For DataVisualization appeared first on Analytics Vidhya. Matplotlib.
ArticleVideo Book This article was published as a part of the DataScience Blogathon DATAVISUALIZATION: DataVisualization is one of the parts of descriptive. The post DATAVISUALIZATION : What Is This And Why It Matters appeared first on Analytics Vidhya.
ArticleVideo Book This article was published as a part of the DataScience Blogathon Introduction Datavisualization is the most important step in the life. The post How To Perform DataVisualization with Pandas appeared first on Analytics Vidhya.
This article was published as a part of the DataScience Blogathon. Introduction You may be asked questions on various topics in a datascience interview. These include statistics, machine learning, probability, datavisualization, data analysis, and behavioral questions.
This article was published as a part of the DataScience Blogathon Image credits: Taras Bakusevych Data is the new oil we have heard it so many times. But can we visualize that data in a proper format? With the amount of data at our disposal today, the need to extract insights from it is […].
ArticleVideo Book This article was published as a part of the DataScience Blogathon Introduction DataVisualization helps to bridge the gap between numbers and. The post Plotly and cufflinks : Advanced Python DataVisualization Libraries appeared first on Analytics Vidhya.
This article was published as a part of the DataScience Blogathon Introduction This article will introduce you to the Spotfire Business Intelligence tool for creating interactive visualization, performing data analysis, and datascience. The latest version is Spotfire 11.
This article was published as a part of the DataScience Blogathon. Introduction Pandas’ Python profiling package produces an interactive set of tables and visualizations for exploratory data exploration (EDA). The post Pandas Profiling – A Visual Analytics Wonder appeared first on Analytics Vidhya.
This article was published as a part of the DataScience Blogathon. Creating a chart or visual in Tableau is. The post 5 Tableau Tips for Designing a Tidy and Impactful Visualization appeared first on Analytics Vidhya. Introduction to Tableau Tips!
ArticleVideos This article was published as a part of the DataScience Blogathon. Introduction Transforming a data set with Principal Component Analysis (PCA) is. The post Visualizing PCA in R-Programming with Factoshiny appeared first on Analytics Vidhya.
This article was published as a part of the DataScience Blogathon Image1 Introduction In this article, I would like to introduce a cool python hand-painted styles visualization package; cute charts. The post Hand Made Visualizations in Python using cutecharts Library appeared first on Analytics Vidhya.
This article was published as a part of the DataScience Blogathon Image 1 Introduction I am sure many of you have read several articles around the world stating the buzz around “Machine Learning, “Data Scientist”, “DataVisualization” and so on. A report […].
This article was published as a part of the DataScience Blogathon Overview Tableau is a well-known datavisualization tool widely used in the industry and adopted by major firms like Nike, Coca-Cola, Skype, TCS, Accenture, and various other plethoras of companies both large and small.
ArticleVideo Book This article was published as a part of the DataScience Blogathon Like the evolution of humans, datavisualization techniques have also been. The post Lollipop Charts: Advanced DataVisualization in Python appeared first on Analytics Vidhya.
ArticleVideo Book This article was published as a part of the DataScience Blogathon Introduction: Seaborn is a Python datavisualization library based on the. The post DataVisualization Using Seaborn For Beginners appeared first on Analytics Vidhya.
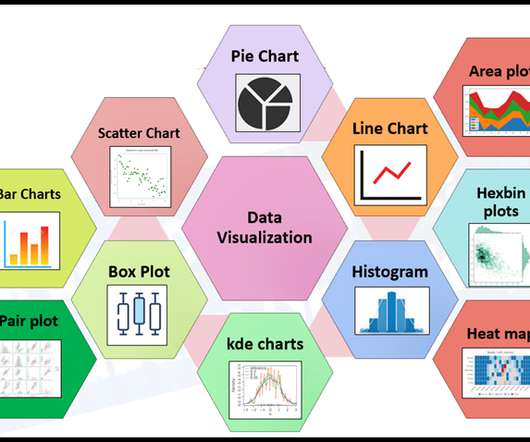
ArticleVideo Book This article was published as a part of the DataScience Blogathon Introduction Human beings are amongst the most creative species on this. The post 8 Charts You Must Know To Excel In The Art of DataVisualization! appeared first on Analytics Vidhya.
This article was published as a part of the DataScience Blogathon. Thus the visualization maps are very important as they provide insight to data even for the non-technical person. The post Visualising Published Articles and Analysing them Using Plotly appeared first on Analytics Vidhya. I […].
ArticleVideos This article was published as a part of the DataScience Blogathon. Introduction Datavisualization in python is perhaps one of the most. The post An Intuitive Guide to DataVisualization in Python appeared first on Analytics Vidhya.
ArticleVideo Book This article was published as a part of the DataScience Blogathon Introduction Sounds can become wrangled within the datascience field through. The post Visualizing Sounds Using Librosa Machine Learning Library! appeared first on Analytics Vidhya.
ArticleVideo Book This article was published as a part of the DataScience Blogathon. Introduction In today’s world, every second the data keeps on. The post Creating Interactive Visualizations using Plotly in Python appeared first on Analytics Vidhya.
ArticleVideo Book This article was published as a part of the DataScience Blogathon. Datavisualization is a process to represent. The post DataVisualizations In Julia Using Plots.jl: With Practical Implementation appeared first on Analytics Vidhya. Introduction Hello Readers!!
This article was published as a part of the DataScience Blogathon. Introduction This article will discuss some datascience interview questions and their answers to help you fare well in job interviews. These are datascience interview questions and are based on datascience topics.
ArticleVideo Book This article was published as a part of the DataScience Blogathon. A beginner’s guide to select plots for Visualization appeared first on Analytics Vidhya. ‘The greatest value of a picture is when it forces. The post When to use what plot ?
ArticleVideo Book This article was published as a part of the DataScience Blogathon. Image Source Introduction We can say that datavisualization is basically. The post Visualizing Netflix Data Using Python! appeared first on Analytics Vidhya.
ArticleVideo Book This article was published as a part of the DataScience Blogathon Introduction Data is everywhere in today’s world of data, and we. The post Interactive DataVisualization Plots with Plotly and Cufflinks appeared first on Analytics Vidhya.
This article was published as a part of the DataScience Blogathon. ows) Visual Programming Software appeared first on Analytics Vidhya. Introduction If you want to know – How to use MACHINE LEARNING. The post Predicting Employee Attrition using Orange(.ows)
This article was published as a part of the DataScience Blogathon R programing language was developed for statistical computing and graphics which makes it one of the desired candidates for DataScience and Analysis.
ArticleVideo Book This article was published as a part of the DataScience Blogathon. Introduction “A visual always brings a first impression.” The post Pandas Visual Analysis – Interactive Visual Analysis appeared first on Analytics Vidhya. ” It’s a.
ArticleVideo Book This article was published as a part of the DataScience Blogathon Introduction Our world is becoming more and more digital, especially after. The post Emojize Your DataScience Projects appeared first on Analytics Vidhya.
This article was published as a part of the DataScience Blogathon. Introduction As the datascience community grows, Python is seen dominating the. The post The Hidden Gems of Python – Libraries that make DataScience a Cakewalk appeared first on Analytics Vidhya.
We organize all of the trending information in your field so you don't have to. Join 42,000+ users and stay up to date on the latest articles your peers are reading.
You know about us, now we want to get to know you!
Let's personalize your content
Let's get even more personalized
We recognize your account from another site in our network, please click 'Send Email' below to continue with verifying your account and setting a password.


Let's personalize your content