This site uses cookies to improve your experience. To help us insure we adhere to various privacy regulations, please select your country/region of residence. If you do not select a country, we will assume you are from the United States. Select your Cookie Settings or view our Privacy Policy and Terms of Use.
Cookie Settings
Cookies and similar technologies are used on this website for proper function of the website, for tracking performance analytics and for marketing purposes. We and some of our third-party providers may use cookie data for various purposes. Please review the cookie settings below and choose your preference.
Used for the proper function of the website
Used for monitoring website traffic and interactions
Cookie Settings
Cookies and similar technologies are used on this website for proper function of the website, for tracking performance analytics and for marketing purposes. We and some of our third-party providers may use cookie data for various purposes. Please review the cookie settings below and choose your preference.
Strictly Necessary: Used for the proper function of the website
Performance/Analytics: Used for monitoring website traffic and interactions
ArticleVideo Book This article was published as a part of the DataScience Blogathon Introduction In applied Statistics and Machine Learning, DataVisualization is one. The post Must Known DataVisualization Techniques for DataScience appeared first on Analytics Vidhya.
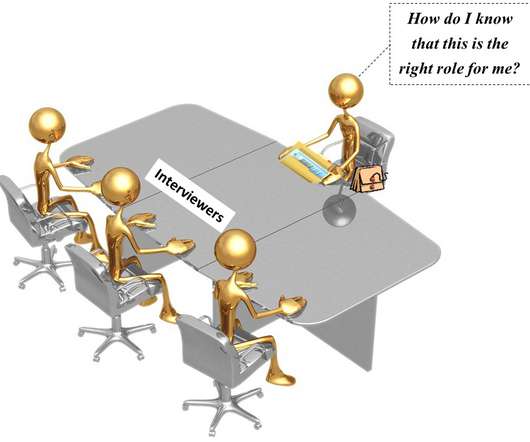
This article was published as a part of the DataScience Blogathon. Introduction You may be asked questions on various topics in a datascience interview. These include statistics, machine learning, probability, datavisualization, data analysis, and behavioral questions.
ArticleVideo Book This article was published as a part of the DataScience Blogathon Let us see a short intro about this blog, Descriptive Statistics. The post Descriptive statistics | A Beginners Guide! appeared first on Analytics Vidhya.
This article was published as a part of the DataScience Blogathon R programing language was developed for statistical computing and graphics which makes it one of the desired candidates for DataScience and Analysis.
I have relied on it since my days of learning statistics back in. The post 8 Useful R Packages for DataScience You Aren’t Using (But Should!) Introduction I’m a big fan of R – it’s no secret. appeared first on Analytics Vidhya.
By gaining the ability to understand, quantify, and leverage the power of online data analysis to your advantage, you will gain a wealth of invaluable insights that will help your business flourish. The ever-evolving, ever-expanding discipline of datascience is relevant to almost every sector or industry imaginable – on a global scale.
This article was published as a part of the DataScience Blogathon. The post Interpreting P-Value and R Squared Score on Real-Time Data – StatisticalData Exploration appeared first on Analytics Vidhya. Overview In this article, I will share my thoughts on the below.
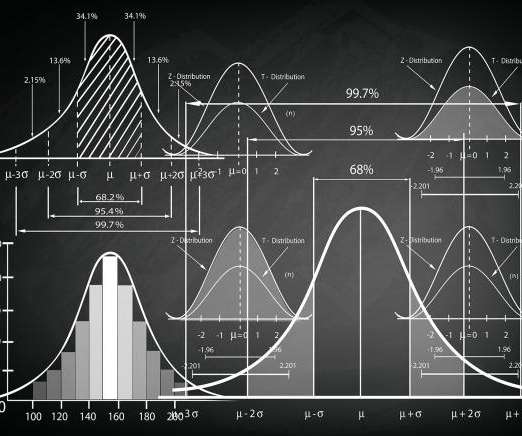
Introduction Statistics is not limited to academic or specific profession. No matter whether you need to study data sciexnce, do some research or just try to handle the information about yourself, you need to understand statistics.
Introduction Datascience has taken over all economic sectors in recent times. To achieve maximum efficiency, every company strives to use various data at every stage of its operations.
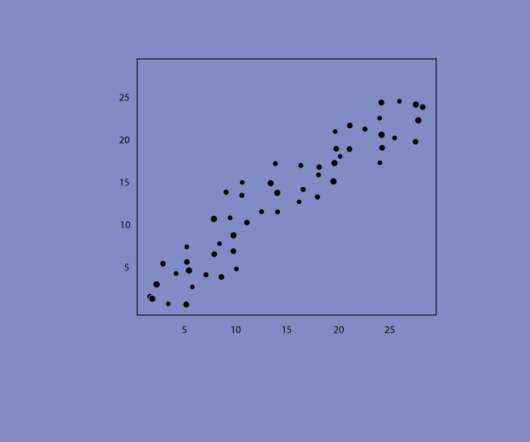
This article was published as a part of the DataScience Blogathon. Introduction Have you ever been tasked with visualizing the relationship between each. The post Creating Linear Model, It’s Equation and Visualization for Analysis appeared first on Analytics Vidhya.
Pursuing any datascience project will help you polish your resume. The post Top DataScience Projects to add to your Portfolio in 2021 appeared first on Analytics Vidhya. Introduction 2021 is a year that proved nothing is better than a Proof of Work to evaluate any candidate’s worth, initiative, and skill.
The post A Comprehensive Step-by-Step Guide to Become an Industry Ready DataScience Professional appeared first on Analytics Vidhya. ArticleVideo Book Introduction to Artificial Intelligence and Machine Learning Artificial Intelligence (AI) and its sub-field Machine Learning (ML) have taken the world by storm.
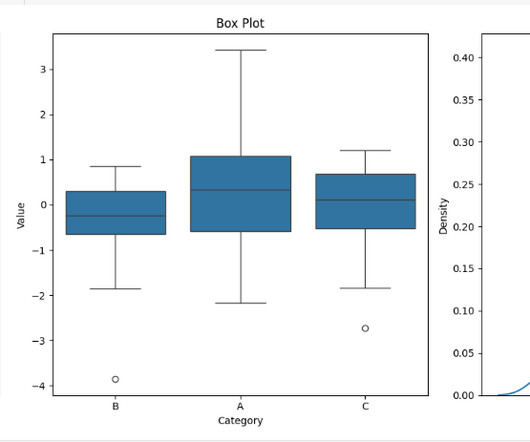
Introduction This article explores violin plots, a powerful visualization tool that combines box plots with density plots. It explains how these plots can reveal patterns in data, making them useful for data scientists and machine learning practitioners.
Datascience has become an extremely rewarding career choice for people interested in extracting, manipulating, and generating insights out of large volumes of data. To fully leverage the power of datascience, scientists often need to obtain skills in databases, statistical programming tools, and datavisualizations.
Introduction I love descriptive statistics. Visualizingdata and analyzing trends is one of the most exciting aspects of any datascience project. The post Extracting and Analyzing 1000 Basketball Games using Pandas and Chartify appeared first on Analytics Vidhya.
The post A Comprehensive Step-by-Step Guide to Become an Industry-Ready DataScience Professional appeared first on Analytics Vidhya. Introduction to Artificial Intelligence and Machine Learning Artificial Intelligence (AI) and its sub-field Machine Learning (ML) have taken the world by storm.
This article was published as a part of the DataScience Blogathon. Introduction Exploratory Data Analysis, or EDA, examines the data and identifies potential relationships between variables using numerical summaries and visualisations.
What is datascience? Datascience is a method for gleaning insights from structured and unstructured data using approaches ranging from statistical analysis to machine learning. Datascience gives the data collected by an organization a purpose. Datascience vs. data analytics.
ArticleVideo Book This article was published as a part of the DataScience Blogathon Introduction Many engineers have never worked in statistics or datascience. The post Know the basics of Exploratory Data Analysis appeared first on Analytics Vidhya.
An education in datascience can help you land a job as a data analyst , data engineer , data architect , or data scientist. Here are the top 15 datascience boot camps to help you launch a career in datascience, according to reviews and data collected from Switchup.
The only cheat you need for a job interview and data professional life. It includes SQL, web scraping, statistics, data wrangling and visualization, business intelligence, machine learning, deep learning, NLP, and super cheat sheets.
The Data Scientist profession today is often considered to be one of the most promising and lucrative. The Bureau of Labor Statistics estimates that the number of data scientists will increase from 32,700 to 37,700 between 2019 and 2029. What is DataScience? Definition: Data Mining vs DataScience.
What is datascience? Datascience is analyzing and predicting data, It is an emerging field. Some of the applications of datascience are driverless cars, gaming AI, movie recommendations, and shopping recommendations. These data models predict outcomes of new data. Statistics.
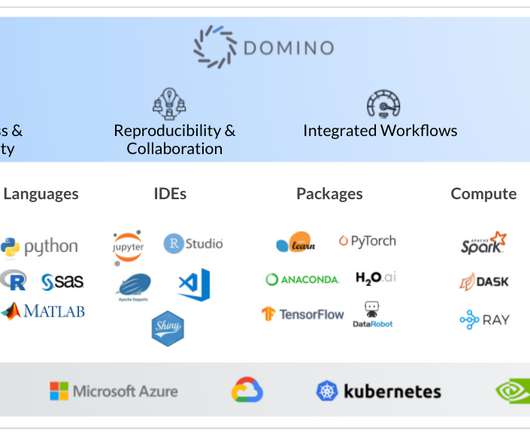
In the multiverse of datascience, the tool options continue to expand and evolve. While there are certainly engineers and scientists who may be entrenched in one camp or another (the R camp vs. Python, for example, or SAS vs. MATLAB), there has been a growing trend towards dispersion of datascience tools.
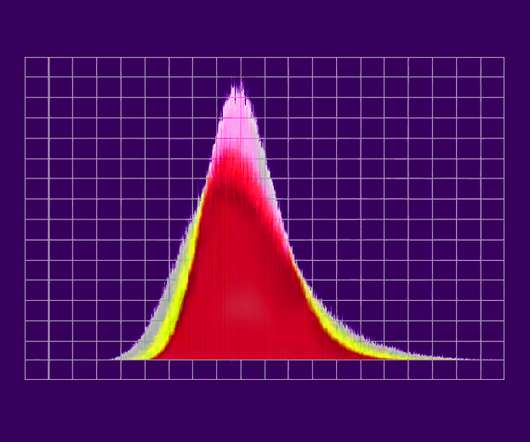
This article was published as a part of the DataScience Blogathon. These graphs project the statistical information about the distribution using the rectangle blocks that, in turn, will launch […]. Introduction Histograms are one of the best plots which can iterate through the distribution of the dataset.
ArticleVideo Book This article was published as a part of the DataScience Blogathon Introduction In the last blog we looked at a test to. Use, Implementation and Visualization appeared first on Analytics Vidhya. The post Decoding the Chi-Square Test?-?Use,
5 SQL Visualization Tools for Data Engineers • Free TensorFlow 2.0 Complete Course • The Importance of Probability in DataScience • 4 Ways to Rename Pandas Columns • 5 Statistical Paradoxes Data Scientists Should Know
Unleash your analytical prowess in today’s most coveted professions – DataScience and Data Analytics! As companies plunge into the world of data, skilled individuals who can extract valuable insights from an ocean of information are in high demand.
The US Bureau of Labor Statistics (BLS) forecasts employment of data scientists will grow 35% from 2022 to 2032, with about 17,000 openings projected on average each year. According to data from PayScale, $99,842 is the average base salary for a data scientist in 2024.
Datascience is an exciting, interdisciplinary field that is revolutionizing the way companies approach every facet of their business. DataScience — A Venn Diagram of Skills. Datascience encapsulates both old and new, traditional and cutting-edge. 3 Components of DataScience Skills.
The boom in datascience continues unabated. The work of gathering and analyzing data was once just for a few scientists back in the lab. Now every enterprise wants to use the power of datascience to streamline their organizations and make customers happy. Data scientists use them to swap ideas and deliver ideas.
According to the US Bureau of Labor Statistics, demand for qualified business intelligence analysts and managers is expected to soar to 14% by 2026, with the overall need for data professionals to climb to 28% by the same year. Visualizations are the best tools to make trends and general insights understandable.
Datascience projects require data professionals to devote their energy toward different activities toward project completion. Data professionals spend their time involved in different activities during a typical datascience project. Cleaning data. Visualizingdata.
Getting your first datascience job might be challenging, but it’s possible to achieve this goal with the right resources. Before jumping into a datascience career , there are a few questions you should be able to answer: How do you break into the profession? What skills do you need to become a data scientist?
But instead of fingers and feet, the clues are subtle and they are embedded in rows and columns of statistical figures. As it is the case with any detective, data professionals […] The post What is Alteryx? An Introductory Guide appeared first on Analytics Vidhya.
Data exploded and became big. Spreadsheets finally took a backseat to actionable and insightful datavisualizations and interactive business dashboards. The rise of self-service analytics democratized the data product chain. 2) Data Discovery/Visualization. We all gained access to the cloud.
Good data can give you keen insights, convincing evidence to make informed decisions. By observing and analyzing data, we can develop more accurate theories and formulate more effective solutions. For this reason, datascience and/vs. Definition: BI vs DataScience vs Data Analytics.
A data scientist must be skilled in many arts: math and statistics, computer science, and domain knowledge. No matter your skill, career level, or title, the ability to analyze, organize, and visualizedata are vital skills in our world of quickly growing and ever-changing data. Linear regression.
It comprises the processes, tools and techniques of data analysis and management, including the collection, organization, and storage of data. The chief aim of data analytics is to apply statistical analysis and technologies on data to find trends and solve problems. It is frequently used for risk analysis.
ArticleVideo Book This article was published as a part of the DataScience Blogathon. When we learn DataScience as beginners we came across. The post 3 Central Tendency Measures – Mean, Mode, Median appeared first on Analytics Vidhya.
As a direct result, less IT support is required to produce reports, trends, visualizations, and insights that facilitate the data decision making process. From these developments, datascience was born (or at least, it evolved in a huge way) – a discipline where hacking skills and statistics meet niche expertise.
This article was published as a part of the DataScience Blogathon. Introduction: Probabilistic Graphical Models (PGM) capture the complex relationships between random variables. The post Complete R Tutorial To Build Probabilistic Graphical Models! appeared first on Analytics Vidhya.
Though you may encounter the terms “datascience” and “data analytics” being used interchangeably in conversations or online, they refer to two distinctly different concepts. Meanwhile, data analytics is the act of examining datasets to extract value and find answers to specific questions.
We organize all of the trending information in your field so you don't have to. Join 42,000+ users and stay up to date on the latest articles your peers are reading.
You know about us, now we want to get to know you!
Let's personalize your content
Let's get even more personalized
We recognize your account from another site in our network, please click 'Send Email' below to continue with verifying your account and setting a password.


Let's personalize your content