This site uses cookies to improve your experience. To help us insure we adhere to various privacy regulations, please select your country/region of residence. If you do not select a country, we will assume you are from the United States. Select your Cookie Settings or view our Privacy Policy and Terms of Use.
Cookie Settings
Cookies and similar technologies are used on this website for proper function of the website, for tracking performance analytics and for marketing purposes. We and some of our third-party providers may use cookie data for various purposes. Please review the cookie settings below and choose your preference.
Used for the proper function of the website
Used for monitoring website traffic and interactions
Cookie Settings
Cookies and similar technologies are used on this website for proper function of the website, for tracking performance analytics and for marketing purposes. We and some of our third-party providers may use cookie data for various purposes. Please review the cookie settings below and choose your preference.
Strictly Necessary: Used for the proper function of the website
Performance/Analytics: Used for monitoring website traffic and interactions
Ali Tore, Senior Vice President of Advanced Analytics at Salesforce, highlighting the value of this integration, says “We’re excited to partner with Amazon to bring Tableau’s powerful data exploration and AI-driven analytics capabilities to customers managing data across organizational boundaries with Amazon DataZone.
Every enterprise needs a datastrategy that clearly defines the technologies, processes, people, and rules needed to safely and securely manage its information assets and practices. Here’s a quick rundown of seven major trends that will likely reshape your organization’s current datastrategy in the days and months ahead.
Why Are We so Focused on DataStrategy? Data is currently the world’s most valuable asset. . Data can tell your business everything, from how productive your staff are to where you’re losing money. How to Empower Digital Transformation Through DataStrategy.
According to the MIT Technology Review Insights Survey, an enterprise datastrategy supports vital business objectives including expanding sales, improving operational efficiency, and reducing time to market. The problem is today, just 13% of organizations excel at delivering on their datastrategy.
As someone deeply involved in shaping datastrategy, governance and analytics for organizations, Im constantly working on everything from defining data vision to building high-performing data teams. My work centers around enabling businesses to leverage data for better decision-making and driving impactful change.
Amazon DataZone is a data management service that makes it faster and easier for customers to catalog, discover, share, and govern data stored across AWS, on premises, and from third-party sources. When you’re connected, you can query, visualize, and share data—governed by Amazon DataZone—within Tableau.
They do not have a single view of their data which affects them. The DataStrategy. GAMWIT , a SaaS solution built by BizAcuity empowers game developers with powerful visual analytics. Evolution from MS Excel to Visual Reporting. Analysis of data is limited to certain elements with Excel. The SaaS route.
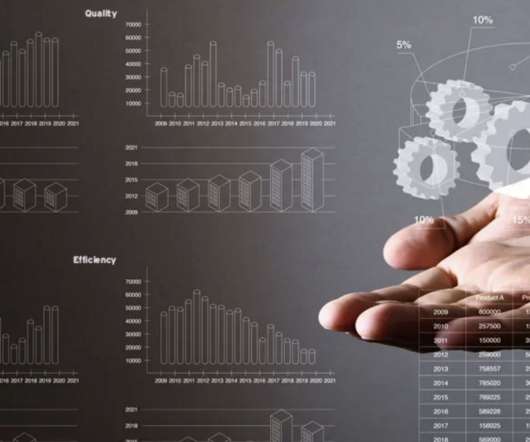
Big data and analytics run on the top priority list for all the organizations in the current era as the majority of the work happens on the data dashboards, reports, KPIs and visualizations. Analytics and Data Science are becoming key dimensions when it comes to considering any digital transformation initiative.
But because of the infrastructure, employees spent hours on manual data analysis and spreadsheet jockeying. We had plenty of reporting, but very little data insight, and no real semblance of a datastrategy. We’re doing KPI visualization and trend analysis, and highlighting variances over time.
Discover features a new data selector to support multiple data sources, a new visual design, query autocomplete and natural language query generation for improved usability. With the enhanced Discover interface, you can now analyze data from multiple sources without switching tools, reducing complexity and improving efficiency.
A Gartner Marketing survey found only 14% of organizations have successfully implemented a C360 solution, due to lack of consensus on what a 360-degree view means, challenges with data quality, and lack of cross-functional governance structure for customer data. Users interested in visual exploration can do so using AWS Glue DataBrew.
Businesses are using real-time data streams to gain insights into their company’s performance and make informed, data-driven decisions faster. As real-time data has become essential for businesses, a growing number of companies are adapting their datastrategy to focus on data in motion.
Business intelligence consulting services offer expertise and guidance to help organizations harness data effectively. Beyond mere data collection, BI consulting helps businesses create a cohesive datastrategy that aligns with organizational goals.
If the reports are designed for your own company, you more or less know what insights will be useful for your staff and what level of data complexity they can struggle through. The visual reports you provide them with should be easy-to-use and actionable. 8) What datavisualizations should you choose?
I addressed this question on the DataStrategy Show with Samir Sharma. Samir Sharma is a datastrategy and analytics leader, CEO and Founder of datazuum. He has a history of helping data executives and leaders craft and execute their datastrategies. How to Learn More about DataVisualization.
Even this breakdown leaves out data management, engineering, and security functions. However, this is only possible if you invest in technology that brings transparency and reliability to AI-performed or AI-assisted data work.
In today’s data-driven world, the datavisualization specialist plays a pivotal role in transforming complex information into visually appealing formats. The demand for skilled professionals in this field is rapidly increasing as businesses rely more on data for decision-making and operations.
Your AI strategy is only as good as your datastrategy,” Tableau CMO Elizabeth Maxon said in a press conference Monday. But to us, it’s more than just having a datastrategy; it’s also about building a great foundation of a data culture.” This is really empowering everyone to be a data expert,” Maxon said.
What is Data Modeling? Data modeling is a process that enables organizations to discover, design, visualize, standardize and deploy high-quality data assets through an intuitive, graphical interface. Data models provide visualization, create additional metadata and standardize data design across the enterprise.
Data architect role Data architects are senior visionaries who translate business requirements into technology requirements and define data standards and principles, often in support of data or digital transformations. In some ways, the data architect is an advanced data engineer.
F1 uses all that data with AWS to gain insights on race strategy and car performance. Stop by the AWS for Data booth in the AWS Village to get datastrategy advice from an AI-powered Data Concierge created by the AWS Generative AI Innovation Center.
This post explores how the shift to a data product mindset is being implemented, the challenges faced, and the early wins that are shaping the future of data management in the Institutional Division. About the Authors Leo Ramsamy is a Platform Architect specializing in data and analytics for ANZ’s Institutional division.
At NAIT (the Northern Alberta Institute of Technology), we have put together a process to visually identify and connect our reports to Data Governance. Any sort of driver to make that a more organic experience for your organization will be an asset. The […].
Ryan Snyder: For a long time, companies would just hire data scientists and point them at their data and expect amazing insights. That strategy is doomed to fail. The best way to start a datastrategy is to establish some real value drivers that the business can get behind. Does the data live in one or many clouds?
The purpose of datavisualization is to facilitate the perception of information arrays and to identify patterns that are difficult to notice in a text table. To make a useful and powerful infographic, you need to follow the laws and regulations of datavisualization.
EMR Studio is an integrated development environment (IDE) that makes it straightforward for data scientists and data engineers to develop, visualize, and debug analytics applications written in PySpark, Python, and Scala. Now you can use a dataset and visualize your data. option("header", "true").option("inferSchema",
Cloud-agnostic analytics platforms can handle data no matter where it lives and serve up game-changing insights. D3 DataVisualization ?— D3 datavisualization tools are your secret weapon when it comes to supercharging your dashboards. Data for All: Empowering Users With AI, ML, and Analytics.
They’re often responsible for building algorithms for accessing raw data, too, but to do this, they need to understand a company’s or client’s objectives, as aligning datastrategies with business goals is important, especially when large and complex datasets and databases are involved.
As a data analyst, you will learn several technical skills that data analysts need to be successful, including: Programming skills. Datavisualization capability. Data Mining skills. Data wrangling ability. Data analysts usually have comprehensive and always-changing skill sets.
Data engineers are often responsible for building algorithms for accessing raw data, but to do this, they need to understand a company’s or client’s objectives, as aligning datastrategies with business goals is important, especially when large and complex datasets and databases are involved.
Several steps are required to turn data into revenue and go even further — including creating the right datastrategy and identifying data opportunities, building your profit and loss statement and use cases, getting buy-in, finding a partner, implementing and launching, and finally growing post-launch through an iterative innovation process.
If you’re obsessed with numerical data, you could easily be led to misleading conclusions. This is an especially important risk to acknowledge when presenting or interpreting data in ways that can potentially skew it. Including more data points, or showing more granular detail aren’t necessarily good things.
Some time later, he has successfully built a customized churn model, based on the company’s own data. Here we see the results in the form of a table: Shaun decides to quickly pull up DataVisualization from within CML, to build some initial visualizations, with the aim to better communicate the results to others in the organization.
And we’ll let you in on a secret: this means nailing your datastrategy. All of this renewed attention on data and AI, however, brings greater potential risks for those companies that have less advanced datastrategies. This involves a mindset shift, and, of course, a comprehensive datastrategy.
Making the most of enterprise data is a top concern for IT leaders today. With organizations seeking to become more data-driven with business decisions, IT leaders must devise datastrategies gear toward creating value from data no matter where — or in what form — it resides. Ensure value with visualizations.
– Data Divination: Big DataStrategies. Big data is changing our world. The rapid development of the Internet and the mobile communication market has created a large amount of data. – Sexy Little Numbers: How to Grow Your Business Using the Data You Already Have. By Pam Baker and Bob Gourley.
Overview: Data science vs data analytics Think of data science as the overarching umbrella that covers a wide range of tasks performed to find patterns in large datasets, structure data for use, train machine learning models and develop artificial intelligence (AI) applications.
Data analytics can help with the UX process. However, you have to have the right datastrategy in place to do this effectively. Here are five ways you can improve the UX of your website with big data. Data-Driven Design Tools Help You Create High-Quality Images. Leverage Machine Learning Technology.
They never see the insights that could spark beneficial strategic change; they can’t lead the way in building a data-driven analytics culture that will safeguard the future of their business. Why datavisualization only goes so far in solving the problem.
A growing number of marketers are exploring the benefits of big data as they strive to improve their branding and outreach strategies. Email marketing is one of the disciplines that has been heavily touched by big data. How to Use Data to Improve Your Email Marketing Strategy. Use Alt Text for Images.
Like other data-driven initiatives, Souza says Digital Athlete uses data rather than hunches and instinct to understand what’s happening on the field during games and practices. The first thing is having a datastrategy, having a foundation of data, and then asking questions of it.”
Data and data management processes are everywhere in the organization so there is a growing need for a comprehensive view of business objects and data. It is therefore vital that data is subject to some form of overarching control, which should be guided by a datastrategy.
You’re well regarded across the industry for having one of the leading datastrategies. There are really four parts to our datastrategy: alignment on framework, focus on value-based priorities, having infrastructure, and talent and inclusiveness. Can you give us some insight into what it entails?
GenAI then builds a network of related topics, generating an enormously expanded base of information, often visualized as a knowledge map. Most notably, for about 71% of IT leaders, angst about security creates a barrier to adoption, mandating that approaches, infrastructure, datastrategies and security be appropriately aligned 3.
We organize all of the trending information in your field so you don't have to. Join 42,000+ users and stay up to date on the latest articles your peers are reading.
You know about us, now we want to get to know you!
Let's personalize your content
Let's get even more personalized
We recognize your account from another site in our network, please click 'Send Email' below to continue with verifying your account and setting a password.


Let's personalize your content