This site uses cookies to improve your experience. To help us insure we adhere to various privacy regulations, please select your country/region of residence. If you do not select a country, we will assume you are from the United States. Select your Cookie Settings or view our Privacy Policy and Terms of Use.
Cookie Settings
Cookies and similar technologies are used on this website for proper function of the website, for tracking performance analytics and for marketing purposes. We and some of our third-party providers may use cookie data for various purposes. Please review the cookie settings below and choose your preference.
Used for the proper function of the website
Used for monitoring website traffic and interactions
Cookie Settings
Cookies and similar technologies are used on this website for proper function of the website, for tracking performance analytics and for marketing purposes. We and some of our third-party providers may use cookie data for various purposes. Please review the cookie settings below and choose your preference.
Strictly Necessary: Used for the proper function of the website
Performance/Analytics: Used for monitoring website traffic and interactions
Forecasting is another critical component of effective inventory management. However, forecasting can be a complex process, and inaccurate predictions can lead to missed opportunities and lost revenue. However, forecasting can be a complex process, and inaccurate predictions can lead to missed opportunities and lost revenue.
By applying BI and predictive forecasting, Smart Flow then helps airport operations determine whether it should offer additional services and products to those passengers or, during periods of reduced foot traffic, reassign resources to more heavily trafficked areas of the airport.
Data professionals need to access and work with this information for businesses to run efficiently, and to make strategic forecasting decisions through AI-powered data models. Without integrating mainframe data, it is likely that AI models and analytics initiatives will have blind spots.
Where is all of that data going to come from? But, by using big data applications to plan for increased or even fluctuating demand across the supply chain, it’s possible to tweak strategies in line with annual trends like market changes or seasonal needs. This is a testament to the brand-boosting power of big data in logistics.
The main requirement is to have an automated, transparent, and long-term semiconductor demand forecast. Additionally, this forecasting system needs to provide data enrichment steps including byproducts, serve as the master data around the semiconductor management, and enable further use cases at the BMW Group.
AI is also making it easier for executives and managers to rapidly forecast, plan and analyze to promote deeper situational awareness and facilitate better-informed decision-making. It is stocked with data gathered from multiple authoritative sources and available for immediate analysis, forecasting, planning and reporting.
What is the difference between business analytics and data analytics? Business analytics is a subset of data analytics. Data analytics is used across disciplines to find trends and solve problems using data mining , data cleansing, datatransformation, data modeling, and more.
In contrast, only 36% of organizations with a weak data culture can say the same. When an enterprise ignores or cannot use their data, they suffer the consequences. These include missing out on new revenue opportunities, poorly forecasting performance, and making bad investments. Start Today with the Alation Data Catalog.
There are countless examples of big datatransforming many different industries. There is no disputing the fact that the collection and analysis of massive amounts of unstructured data has been a huge breakthrough. In forecasting future events. Prescriptive analytics.
JustPerform provides an all-in-one planning, forecasting, and financial close companion that enables finance teams to collaborate seamlessly, close faster, report accurately, and make confident decisions. Implementing this solution enables Fresca to improve its financial close and consolidation, and disclosure management processes.
Companies are increasingly eager to hire data professionals who can make sense of the wide array of data the business collects. The US Bureau of Labor Statistics (BLS) forecasts employment of data scientists will grow 35% from 2022 to 2032, with about 17,000 openings projected on average each year.
Data analytics draws from a range of disciplines — including computer programming, mathematics, and statistics — to perform analysis on data in an effort to describe, predict, and improve performance. What are the four types of data analytics? It is frequently used for economic and sales forecasting.
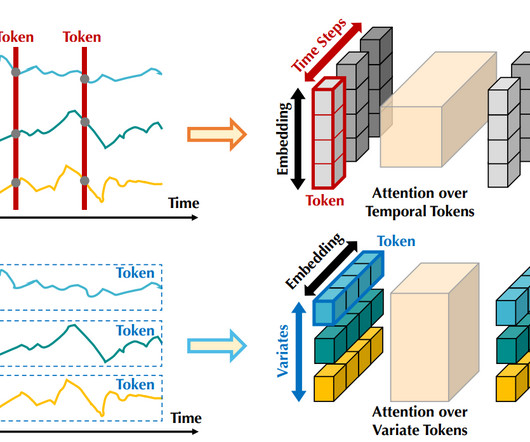
Introduction Transformers have revolutionized various domains of machine learning, notably in natural language processing (NLP) and computer vision. Their ability to capture long-range dependencies and handle sequential data effectively has made them a staple in every AI researcher and practitioner’s toolbox.
But to augment its various businesses with ML and AI, Iyengar’s team first had to break down data silos within the organization and transform the company’s data operations. Digitizing was our first stake at the table in our data journey,” he says.
However, their manual planning and budgeting process in spreadsheets posed several challenges, including lack of control, delayed data, poor execution, and the need for continuous follow-up with IT for actual data. They faced obstacles such as a prolonged budget process, manual forecasting, and no product profitability.
It seamlessly consolidates data from various data sources within AWS, including AWS Cost Explorer (and forecasting with Cost Explorer ), AWS Trusted Advisor , and AWS Compute Optimizer. The difference lies in when and where datatransformation takes place.
In financial services, mismatched definitions of active account or incomplete know-your-customers (KYC) data can distort risk models and stall customer onboarding. In healthcare, missing treatment data or inconsistent coding undermines clinical AI models and affects patient safety. Embed end-to-end lineage tracking.
For that reason, businesses must think about the flow of data across multiple systems that fuel organizational decision-making. For example, the marketing department uses demographics and customer behavior to forecast sales. Business terms and data policies should be implemented through standardized and documented business rules.
But the features in Power BI Premium are now more powerful than the functionality in Azure Analysis Services, so while the service isn’t going away, Microsoft will offer an automated migration tool in the second half of this year for customers who want to move their data models into Power BI instead. Azure Data Factory.
Due to this low complexity, the solution uses AWS serverless services to ingest the data, transform it, and make it available for analytics. In addition, you can use ML in QuickSight to gain ML-driven insights, detect pricing anomalies, and create forecasts based on historical files.
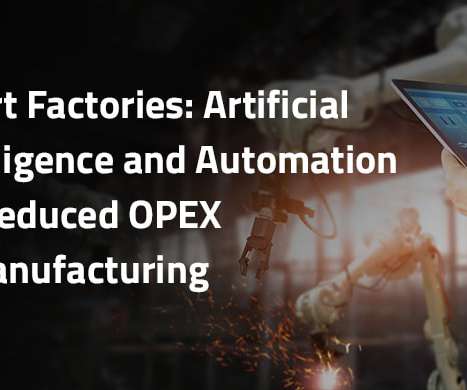
As manufacturing plants start to inject autonomous machines into their day-to-day operations, there is a growing need to monitor these devices and forecast maintenance requirements before failure and downtime. Time-Series Forecasting?—? Over the past two years our supply chain has been in the spotlight.
Elevate your datatransformation journey with Dataiku’s comprehensive suite of solutions. Innovations in 2024 Enhanced Data Security Measures: In 2024, Tableau will introduce enhanced data security measures to ensure the protection of sensitive information and compliance with data regulations.
Looking at the diagram, we see that Business Intelligence (BI) is a collection of analytical methods applied to big data to surface actionable intelligence by identifying patterns in voluminous data. As we move from right to left in the diagram, from big data to BI, we notice that unstructured datatransforms into structured data.
Looking at the diagram, we see that Business Intelligence (BI) is a collection of analytical methods applied to big data to surface actionable intelligence by identifying patterns in voluminous data. As we move from right to left in the diagram, from big data to BI, we notice that unstructured datatransforms into structured data.
They invested heavily in data infrastructure and hired a talented team of data scientists and analysts. The goal was to develop sophisticated data products, such as predictive analytics models to forecast patient needs, patient care optimization tools, and operational efficiency dashboards.
In addition to monitoring the performance of data-related systems, DataOps observability also involves the use of analytics and machine learning to gain insights into the behavior and trends of data. The data scientists and IT professionals were starting to get frustrated, when suddenly, a magical fairy appeared out of nowhere.
With this cluster design, we can get the hourly workload resource usage forecast. Then it generates the hourly aggregated resource usage forecast using a Python program. His area of interests are data lakes and cloud modern data architecture delivery.
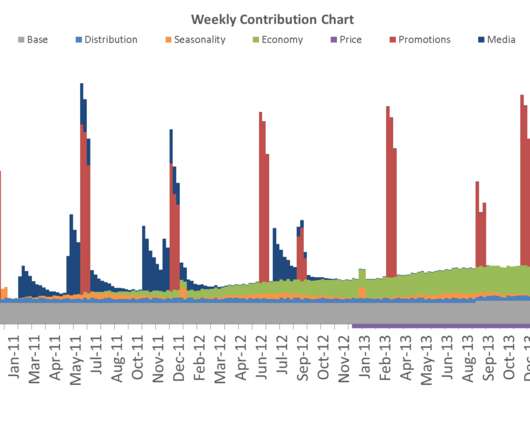
Before the data is put into the model comes a process called feature engineering – transforming the original data columns to impose certain business assumptions or simply increase model accuracy. But the principles and techniques for MMMs have remained practically unchanged over the last 30 years.
This field guide to data mapping will explore how data mapping connects volumes of data for enhanced decision-making. Why Data Mapping is Important Data mapping is a critical element of any data management initiative, such as data integration, data migration, datatransformation, data warehousing, or automation.
Data Extraction : The process of gathering data from disparate sources, each of which may have its own schema defining the structure and format of the data and making it available for processing. This can include tasks such as data ingestion, cleansing, filtering, aggregation, or standardization.
However, to truly unlock this potential, complete data preparation and control are essential. Just like a powerful engine needs high-quality fuel, AI relies on clean, consistent data across the Oracle ecosystem. This ensures the accuracy of AI-generated forecasts, cash flow optimizations, and the discovery of hidden financial truths.
Complex Data Structures and Integration Processes Dynamics data structures are already complex – finance teams navigating Dynamics data frequently require IT department support to complete their routine reporting.
Trino allows users to run ad hoc queries across massive datasets, making real-time decision-making a reality without needing extensive datatransformations. This is particularly valuable for teams that require instant answers from their data. Data Lake Analytics: Trino doesn’t just stop at databases.
Healthcare is forecasted for significant growth in the near future. Head of Sales Priorities Make quota Get an accurate forecast Beat the competition Expand market share Facilitate customer success Connect the Dots Remember that the sales team is on the front lines. addresses).
Speed time to market with faster data migration, easier datatransformation. Wands for SAP Wands for SAP empowers your finance team to leverage their existing Excel skills to streamline data entry to drive efficiencies in your month-end process. Time-to-value acceleration — Quick installation.
It streamlines data integration, ensures real-time access to accurate information, enhances collaboration, and provides the flexibility needed to adapt to evolving ERP systems and business requirements. Datatransformation ensures that the data aligns with the requirements of the new cloud ERP system.
By providing a consistent and stable backend, Apache Iceberg ensures that data remains immutable and query performance is optimized, thus enabling businesses to trust and rely on their BI tools for critical insights. It provides a stable schema, supports complex datatransformations, and ensures atomic operations.
Together, CXO and Power BI provide you with access to insights from both EPM and BI data in one tool. You can now elevate their decision-making process by drilling down into more detailed data, and enriching EPM figures with non-financial data. Transforming Financial Reporting with Dynamic Dashboards Download Now 1.
Data Connectivity Enhancements Data and content authors are the first users in the app building infrastructure and content. It is important for our customers to access advanced connectors and datatransformation features so they can build a robust data layer.
This approach allows you and your customers to harness the full potential of your data, transforming it into interactive, AI-driven conversations that can significantly enhance user engagement and insight discovery. Unlike competitors who lock you into their pre-built AI solutions, Logi AI empowers you with the freedom to choose.
Data Lineage and Documentation Jet Analytics simplifies the process of documenting data assets and tracking data lineage in Fabric. It offers a transparent and accurate view of how data flows through the system, ensuring robust compliance.
Users will have access to out-of-the-box data connectors, pre-built plug-and-play analytics projects, a repository of reports, and an intuitive drag-and-drop interface so they can begin extracting and analyzing key business data within hours.
March 31, 2025 insightsoftware , the most comprehensive provider of solutions for the Office of the CFO, today announced the global expansion of JustPerform , an all-in-one financial planning, forecasting, and close companion. Real-Time Planning: Live data updates keep financial and operational planning connected across teams.
A knowledge layer can be built on top of the data infrastructure to provide context and minimize hallucinations. If somebody in telco runs a forecasting model, the variables, inputs, and results will be different than running the same model for financial forecasting, she says.
We organize all of the trending information in your field so you don't have to. Join 42,000+ users and stay up to date on the latest articles your peers are reading.
You know about us, now we want to get to know you!
Let's personalize your content
Let's get even more personalized
We recognize your account from another site in our network, please click 'Send Email' below to continue with verifying your account and setting a password.


Let's personalize your content