This site uses cookies to improve your experience. To help us insure we adhere to various privacy regulations, please select your country/region of residence. If you do not select a country, we will assume you are from the United States. Select your Cookie Settings or view our Privacy Policy and Terms of Use.
Cookie Settings
Cookies and similar technologies are used on this website for proper function of the website, for tracking performance analytics and for marketing purposes. We and some of our third-party providers may use cookie data for various purposes. Please review the cookie settings below and choose your preference.
Used for the proper function of the website
Used for monitoring website traffic and interactions
Cookie Settings
Cookies and similar technologies are used on this website for proper function of the website, for tracking performance analytics and for marketing purposes. We and some of our third-party providers may use cookie data for various purposes. Please review the cookie settings below and choose your preference.
Strictly Necessary: Used for the proper function of the website
Performance/Analytics: Used for monitoring website traffic and interactions
Their terminal operations rely heavily on seamless data flows and the management of vast volumes of data. Recently, EUROGATE has developed a digital twin for its container terminal Hamburg (CTH), generating millions of data points every second from Internet of Things (IoT)devices attached to its container handling equipment (CHE).
At Atlanta’s Hartsfield-Jackson International Airport, an IT pilot has led to a wholesale data journey destined to transform operations at the world’s busiest airport, fueled by machine learning and generative AI. That enables the analytics team using Power BI to create a single visualization for the GM.”
With the ability to browse metadata, you can understand the structure and schema of the data source, identify relevant tables and fields, and discover useful data assets you may not be aware of. You can navigate to the projects Data page to visually verify the existence of the newly created table. option("url", jdbcurl).option("dbtable",
In 2024, datavisualization companies play a pivotal role in transforming complex data into captivating narratives. This blog provides an insightful exploration of the leading entities shaping the datavisualization landscape.
Notebooks are provisioned quickly and provide a way for you to instantly view and analyze your streaming data. This pipeline could further be used to send data to Amazon OpenSearch Service or other targets for additional processing and visualization. View the stream data. Transform and enrich the data.
If storing operational data in a data warehouse is a requirement, synchronization of tables between operational data stores and Amazon Redshift tables is supported. In scenarios where datatransformation is required, you can use Redshift stored procedures to modify data in Redshift tables. AWS Glue 4.0
But the features in Power BI Premium are now more powerful than the functionality in Azure Analysis Services, so while the service isn’t going away, Microsoft will offer an automated migration tool in the second half of this year for customers who want to move their data models into Power BI instead. Azure Data Factory.
Here are a few examples that we have seen of how this can be done: Batch ETL with Azure Data Factory and Azure Databricks: In this pattern, Azure Data Factory is used to orchestrate and schedule batch ETL processes. Azure Blob Storage serves as the data lake to store raw data. Azure Machine Learning).
The world is moving faster than ever, and companies processing large amounts of rapidly changing or growing data need to evolve to keep up — especially with the growth of Internet of Things (IoT) devices all around us. Let’s look at a few ways that different industries take advantage of streaming data.
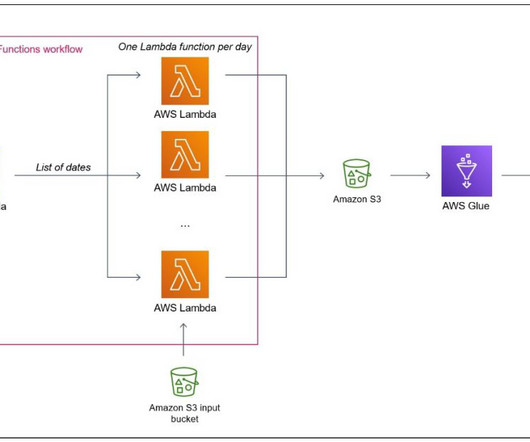
It has not been specifically designed for heavy datatransformation tasks. Configure the Step Functions workflow After you create the two Lambda functions, you can design the Step Functions workflow in the visual editor by using the Lambda Invoke and Map blocks, as shown in the following diagram. Add a data source block.
The solution consists of the following interfaces: IoT or mobile application – A mobile application or an Internet of Things (IoT) device allows the tracking of a company vehicle while it is in use and transmits its current location securely to the data ingestion layer in AWS.
Data collection and processing are handled by a third-party smart sensor manufacturer application residing in Amazon Virtual Private Cloud (Amazon VPC) private subnets behind a Network Load Balancer. The AWS Glue Data Catalog contains the table definitions for the smart sensor data sources stored in the S3 buckets.
In this post, we dive deep into the tool, walking through all steps from log ingestion, transformation, visualization, and architecture design to calculate TCO. With QuickSight, you can visualize YARN log data and conduct analysis against the datasets generated by pre-built dashboard templates and a widget.
In 2024, business intelligence (BI) software has undergone significant advancements, revolutionizing data management and decision-making processes. Harnessing the power of advanced APIs, automation, and AI, these tools simplify data compilation, organization, and visualization, empowering users to extract actionable insights effortlessly.
Before we dive into the topics of big data as a service and analytics applied to same, let’s quickly clarify data analytics using an oft-used application of analytics: Visualization! As we move from right to left in the diagram, from big data to BI, we notice that unstructured datatransforms into structured data.
Before we dive into the topics of big data as a service and analytics applied to same, let’s quickly clarify data analytics using an oft-used application of analytics: Visualization! As we move from right to left in the diagram, from big data to BI, we notice that unstructured datatransforms into structured data.
However, you might face significant challenges when planning for a large-scale data warehouse migration. Data engineers are crucial for schema conversion and datatransformation, and DBAs can handle cluster configuration and workload monitoring. Platform architects define a well-architected platform.
Data Extraction : The process of gathering data from disparate sources, each of which may have its own schema defining the structure and format of the data and making it available for processing. This can include tasks such as data ingestion, cleansing, filtering, aggregation, or standardization.
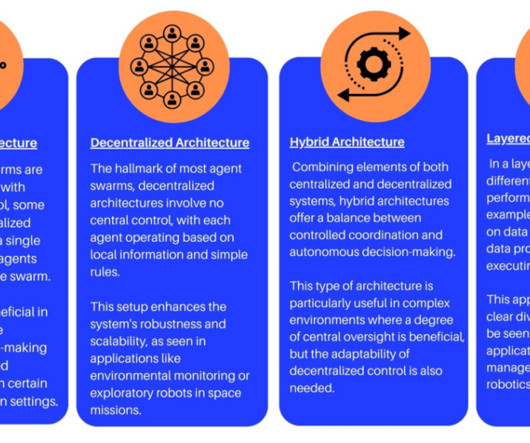
The Agent Swarm evolution has been propelled by advancements in computing, artificial intelligence (AI), machine learning (ML), and the Internet of Things (IoT). Gather/Insert data on market trends, customer behavior, inventory levels, or operational efficiency. GUI, dashboarding software, and datavisualization technologies.
We organize all of the trending information in your field so you don't have to. Join 42,000+ users and stay up to date on the latest articles your peers are reading.
You know about us, now we want to get to know you!
Let's personalize your content
Let's get even more personalized
We recognize your account from another site in our network, please click 'Send Email' below to continue with verifying your account and setting a password.


Let's personalize your content