This site uses cookies to improve your experience. To help us insure we adhere to various privacy regulations, please select your country/region of residence. If you do not select a country, we will assume you are from the United States. Select your Cookie Settings or view our Privacy Policy and Terms of Use.
Cookie Settings
Cookies and similar technologies are used on this website for proper function of the website, for tracking performance analytics and for marketing purposes. We and some of our third-party providers may use cookie data for various purposes. Please review the cookie settings below and choose your preference.
Used for the proper function of the website
Used for monitoring website traffic and interactions
Cookie Settings
Cookies and similar technologies are used on this website for proper function of the website, for tracking performance analytics and for marketing purposes. We and some of our third-party providers may use cookie data for various purposes. Please review the cookie settings below and choose your preference.
Strictly Necessary: Used for the proper function of the website
Performance/Analytics: Used for monitoring website traffic and interactions
Business analytics is the practical application of statistical analysis and technologies on business data to identify and anticipate trends and predict business outcomes. Business analytics is a subset of data analytics. What is business analytics? What is the difference between business analytics and business intelligence?
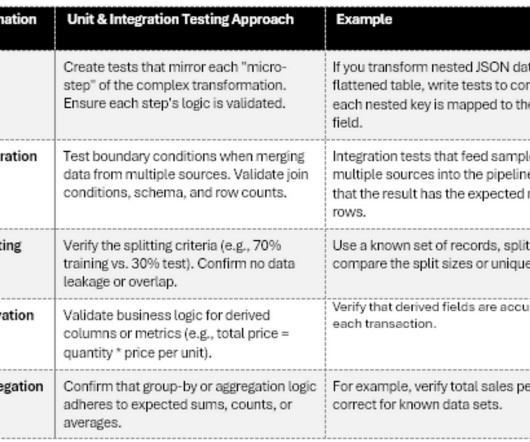
In this post, well see the fundamental procedures, tools, and techniques that data engineers, data scientists, and QA/testing teams use to ensure high-quality data as soon as its deployed. First, we look at how unit and integration tests uncover transformation errors at an early stage. Statistical tests (e.g.,
It comprises the processes, tools and techniques of data analysis and management, including the collection, organization, and storage of data. The chief aim of data analytics is to apply statistical analysis and technologies on data to find trends and solve problems. What are the four types of data analytics?
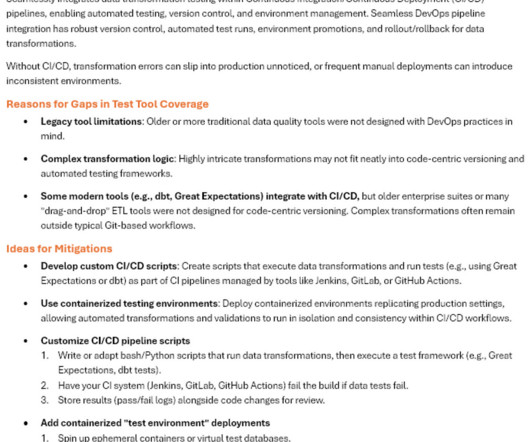
Managing tests of complex datatransformations when automated data testing tools lack important features? Photo by Marvin Meyer on Unsplash Introduction Datatransformations are at the core of modern business intelligence, blending and converting disparate datasets into coherent, reliable outputs.
AI is transforming how senior data engineers and data scientists validate datatransformations and conversions. Artificial intelligence-based verification approaches aid in the detection of anomalies, the enforcement of data integrity, and the optimization of pipelines for improved efficiency.
so, understanding their importance is the key: Faster Data Mapping: AI-enabled solutions can help users map customer data in minutes instead of months. This speeds up datatransformation and decision-making. Not only will this increase the speed but also the accuracy of the data mapping process.
Companies are increasingly eager to hire data professionals who can make sense of the wide array of data the business collects. The US Bureau of Labor Statistics (BLS) forecasts employment of data scientists will grow 35% from 2022 to 2032, with about 17,000 openings projected on average each year.
Adding datatransformation details to metadata can be challenging because of the dispersed nature of this information across data processing pipelines, making it difficult to extract and incorporate into table-level metadata. Maintaining lists of possible values for the columns requires continuous updates.
This person (or group of individuals) ensures that the theory behind data quality is communicated to the development team. 2 – Data profiling. Data profiling is an essential process in the DQM lifecycle. This means there are no unintended data errors, and it corresponds to its appropriate designation (e.g.,
DataOps Observability can help you ensure that your complex data pipelines and processes are accurate and that they deliver as designed. Observability also validates that your datatransformations, models, and reports are performing as expected. to monitor your data operations. without replacing staff or systems?to
This allows data analysts and data scientists to rapidly construct the necessary data preparation steps to meet their business needs. We use the new data preparation authoring capabilities to create recipes that meet our specific business needs for datatransformations.
Such teams tend to view analytic pipelines as analogous to lean manufacturing lines and regularly reflect on feedback provided by customers, team members, and operational statistics. Analytics, Collaboration Software, Data Management, Data Mining, Data Science, IT Strategy, Small and Medium Business.
For that reason, businesses must think about the flow of data across multiple systems that fuel organizational decision-making. The CEO also makes decisions based on performance and growth statistics. Business terms and data policies should be implemented through standardized and documented business rules.
Data Science – Data science is the field of study that combines domain expertise, programming skills, and knowledge of mathematics and statistics to extract meaningful insights from data. For example, data can be filtered so that the investigation can be focused more specifically.
DataOps Observability can help you ensure that your complex data pipelines and processes are accurate and that they deliver as designed. Observability also validates that your datatransformations, models, and reports are performing as expected. to monitor your data operations. without replacing staff or systems?to
After the read query validation stage was complete and we were satisfied with the performance, we reconnected our orchestrator so that the datatransformation queries could be run in the new cluster. It represents a significant decrease in the delivery time of our critical data analytics processes.
High variance in a model may indicate the model works with training data but be inadequate for real-world industry use cases. Limited data scope and non-representative answers: When data sources are restrictive, homogeneous or contain mistaken duplicates, statistical errors like sampling bias can skew all results.
This does away with the need for analysts to repeatedly perform data extraction, enrichment or transformation motions from the required source systems, all but eliminating the substantial amount of time analysts and business users spend routinely on data preparation.
Data collection and processing are handled by a third-party smart sensor manufacturer application residing in Amazon Virtual Private Cloud (Amazon VPC) private subnets behind a Network Load Balancer. The AWS Glue Data Catalog contains the table definitions for the smart sensor data sources stored in the S3 buckets.
Stock Data – for pulling the stock data, I used alpha vantage service (free version). Basically, it’s a service that allows you to get a daily summary for stocks statistics (open, close, low, high- volume). Log in to Cloudera Data Platform Public Cloud control plane. b) Basic datatransformation.
Metadata store – We use Spark’s in-memory data catalog to store metadata for TPC-DS databases and tables— spark.sql.catalogImplementation is set to the default value in-memory. No statistics are pre-calculated for these tables. About the Authors Melody Yang is a Senior Big Data Solution Architect for Amazon EMR at AWS.
Stored procedures are commonly used to encapsulate logic for datatransformation, data validation, and business-specific logic. She focuses on query optimization, statistics and SQL language features. It supports stored procedures where prepared SQL code is saved and the code can be reused over and over again.
The UI allows users to parse their source data in formats including JSON, CSV, Avro, Parquet and Protobuf. A sample from the parsed data is displayed before ingestion starts: Schema on read and statistics per field are automatically detected and presented to the user: Step 2: Define stateful transformations.
Data Analysis Report (by FineReport ) Note: All the data analysis reports in this article are created using the FineReport reporting tool. Leveraging the advanced enterprise-level web reporting tool capabilities of FineReport , we empower businesses to achieve genuine datatransformation. Try FineReport Now 1.
Now, joint users will get an enhanced view into cloud and datatransformations , with valuable context to guide smarter usage. Integrating helpful metadata into user workflows gives all people, from data scientists to analysts , the context they need to use data more effectively.
However, you might face significant challenges when planning for a large-scale data warehouse migration. Data engineers are crucial for schema conversion and datatransformation, and DBAs can handle cluster configuration and workload monitoring. This can help identify any discrepancies in data values or data types.
Furthermore, it allows for necessary actions to be taken, such as rectifying errors in the data source, refining datatransformation processes, and updating data quality rules. The Lambda function sends an SNS notification containing data quality statistics to the designated email address.
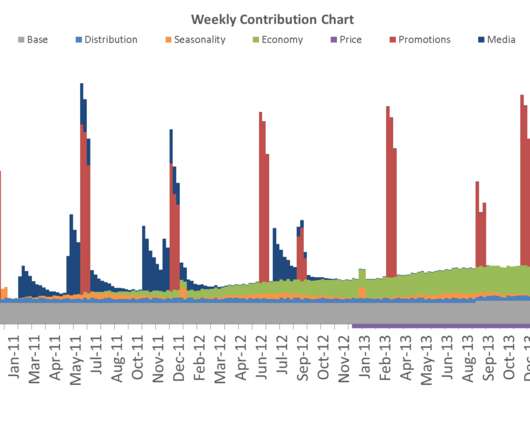
MMM stands for Marketing Mix Model and it is one of the oldest and most well-established techniques to measure the sales impact of marketing activity statistically. Data Requirements. As with any type of statistical model, data is key and GIGO (“Garbage In, Garbage Out”) principle definitely applies. What is MMM?
Sample dashboard overview The following screenshots illustrate the different components of our sample QuickSight dashboard: Summary tab – This view aggregates call statistics across data points such as average customer sentiments and average agent talk duration, along with detailed call records. Graphs like “Who Talks More?”
Recentering the data means that we translate the values so that the extremes are different and the intermediate values are moved in some consistent way. Often, rescaling will also result in recentered data. Standardization , a statistical rescaling, is a bit trickier. Here are a few examples: DataTransformation from [link].
Based on the statistics of individual and aggregated application runs per queue and per user, you can determine the existing workload distribution by user. His area of interests are data lakes and cloud modern data architecture delivery. Kalen Zhang was the Global Segment Tech Lead of Partner Data and Analytics at AWS.
Organizations have spent a lot of time and money trying to harmonize data across diverse platforms , including cleansing, uploading metadata, converting code, defining business glossaries, tracking datatransformations and so on.
DataBrew is a visual data preparation tool that enables you to clean and normalize data without writing any code. The over 200 transformations it provides are now available to be used in an AWS Glue Studio visual job.
Report after report validates this claim, with research showing that data-driven companies consistently outperform competitors by as much as 85% in sales growth , gross margin , operating margins, and other key financial performance indicators. of company leaders report having achieved their goal to become data-driven.
YARN log collector The HMDK TCO tool enables a simple way to capture Hadoop YARN logs, which include the Hadoop job runs statistics and the corresponding resource usages. His area of interests are data lakes and cloud modern data architecture delivery. You can use tired storage in Amazon S3 for cost savings.
Data Extraction : The process of gathering data from disparate sources, each of which may have its own schema defining the structure and format of the data and making it available for processing. This can include tasks such as data ingestion, cleansing, filtering, aggregation, or standardization.
Some cloud applications can even provide new benchmarks based on customer data. Advanced Analytics Some apps provide a unique value proposition through the development of advanced (and often proprietary) statistical models. Advanced Analytics Provide the unique benefit of advanced (and often proprietary) statistical models in your app.
Data testing is an essential aspect of DataOps Observability; it helps to ensure that data is accurate, complete, and consistent with its specifications, documentation, and end-user requirements. Data testing can be done through various methods, such as data profiling, Statistical Process Control, and quality checks.
Individuals with this certification have proven the ability to connect to data sources, perform datatransformations, explore and analyze data, and create meaningful visualizations that answer key business questions. The Tableau Certified Data Analyst title is active for two years from the date achieved.
We organize all of the trending information in your field so you don't have to. Join 42,000+ users and stay up to date on the latest articles your peers are reading.
You know about us, now we want to get to know you!
Let's personalize your content
Let's get even more personalized
We recognize your account from another site in our network, please click 'Send Email' below to continue with verifying your account and setting a password.


Let's personalize your content