This site uses cookies to improve your experience. To help us insure we adhere to various privacy regulations, please select your country/region of residence. If you do not select a country, we will assume you are from the United States. Select your Cookie Settings or view our Privacy Policy and Terms of Use.
Cookie Settings
Cookies and similar technologies are used on this website for proper function of the website, for tracking performance analytics and for marketing purposes. We and some of our third-party providers may use cookie data for various purposes. Please review the cookie settings below and choose your preference.
Used for the proper function of the website
Used for monitoring website traffic and interactions
Cookie Settings
Cookies and similar technologies are used on this website for proper function of the website, for tracking performance analytics and for marketing purposes. We and some of our third-party providers may use cookie data for various purposes. Please review the cookie settings below and choose your preference.
Strictly Necessary: Used for the proper function of the website
Performance/Analytics: Used for monitoring website traffic and interactions
Organizations constantly work to process and analyze vast volumes of data to derive actionable insights. Effective data ingestion and search capabilities have become essential for use cases like log analytics, application search, and enterprise search. Each implementation is independent of the others.
Organizations today face the challenge of managing and deriving insights from an ever-expanding universe of data in real time. As data volumes grow, organizations increasingly struggle with fragmented monitoring tools that create critical visibility gaps and slow incident response times.
With its advanced indexing, full-text search, and real-time analytics capabilities, OpenSearch Service makes it possible for organizations to seamlessly ingest, process, and search log data across diverse sources—including AWS services like Amazon CloudWatch , VPC Flow Logs, and more. Choose your domain to open the domain details page.
Whether you are a consultant, marketer, researcher, or financial analyst…a big part of your job is presenting data. It takes a special combination of skills to articulate your insights and support them with effectively visualizeddata. You need to be part salesperson, part data analyst, and part author.
1] This includes C-suite executives, front-line data scientists, and risk, legal, and compliance personnel. These recommendations are based on our experience, both as a data scientist and as a lawyer, focused on managing the risks of deploying ML. Model decay : ML models and data pipelines are notoriously “brittle.” [5]
Without big data analytics, companies are blind and deaf, wandering out onto the Web like deer on a freeway. We are indeed living in a time rich in invaluable digital data. Companies that use data analytics are five times more likely to make faster decisions, based on a survey conducted by Bain & Company.
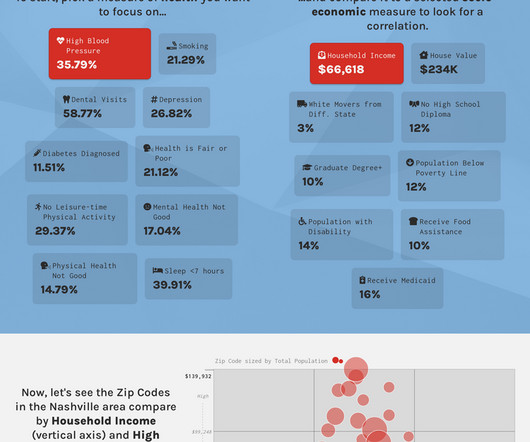
I’m a long-time advocate for adding specificity into data presentation as a way to humanize your message. Specific examples are a way to zoom in to the details while connecting your audience to the big picture ideas. The goal was to use data to drive the discussion on health disparities in our local Nashville community.
Business analysts (BAs) are responsible for bridging the gap between IT and the business using data analytics to assess processes, determine requirements, and deliver data-driven recommendations and reports to executives and stakeholders. Business analyst skills The business analyst position requires both hard skills and soft skills.
Being a business analyst is a journey filled with challenges and triumphs, where the treasure is not just data but insights that transform businesses. Remember, while it could be tempting to produce really extensive, detailed reports, something any BA is proud of, the objective is to enable change through your insights.
Visualizingdata in charts, graphs, dashboards, and infographics is one of the most powerful strategies for getting your numbers out of your spreadsheets and into real-world conversations. But it can be overwhelming to get started with datavisualization. If so, this step-by-step datavisualization guide is for you!
Amazon Redshift is the most widely used data warehouse in the cloud, best suited for analyzing exabytes of data and running complex analytical queries. Amazon QuickSight is a fast business analytics service to build visualizations, perform ad hoc analysis, and quickly get business insights from your data.
I can’t tell you how many times I’ve heard this from workshop participants. I’m normally very zen about datavisualization. Here’s my calm before the storm selfie: Inside the Depict Data Studio World Headquarters. But with some behind-the-scenes editing, we can still make powerful visualizations inside Excel.”.
In today’s data-driven landscape, managing and analyzing vast amounts of data, especially logs, is crucial for organizations to derive insights and make informed decisions. We recently announced a new capacity level of 30TB for time series data per account per AWS Region.
In this post, you will learn how you can use Amazon Kinesis Data Firehose to build a log ingestion pipeline to send VPC flow logs to Amazon OpenSearch Serverless. Kinesis Data Firehose is a popular service that delivers streaming data from over 20 AWS services to over 15 analytical and observability tools such as OpenSearch Serverless.
Many of them cover topics that are relevant to my work in data sensemaking and datavisualization, and most of them are quite good, but only a few are extraordinary. Until recently, I taught annual datavisualizationworkshops in Utrecht for several years. I spend a great deal of time reading books.
To optimize your CS offerings you need access to the right data, and this is where customer service reports come into play. Customer service reports extract invaluable information and insights from customer service data. Get our guide to learn about the power of customer service reporting! What Is A Customer Service Report?
Getting your first data science job might be challenging, but it’s possible to achieve this goal with the right resources. Before jumping into a data science career , there are a few questions you should be able to answer: How do you break into the profession? What skills do you need to become a data scientist? Data Scientists.
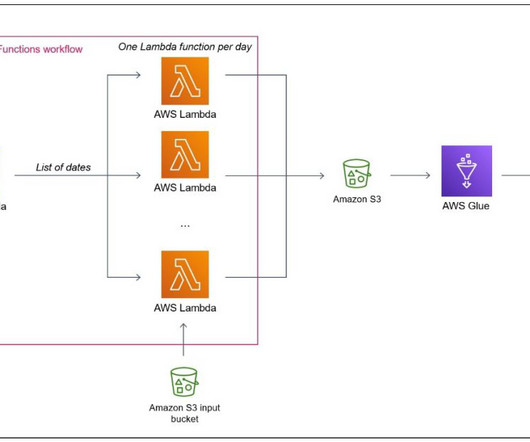
Extracting time series on given geographical coordinates from satellite or Numerical Weather Prediction data can be challenging because of the volume of data and of its multidimensional nature (time, latitude, longitude, height, multiple parameters). It has not been specifically designed for heavy data transformation tasks.
EMR Studio is an integrated development environment (IDE) that makes it straightforward for data scientists and data engineers to develop, visualize, and debug analytics applications written in PySpark, Python, and Scala. Now you can use a dataset and visualize your data. option("header", "true").option("inferSchema",
She is also the founder of the Sketchnote Academy and author of The Art of Visual Notetaking. . Sketchnoting is also called: Visual notetaking Graphic recording Visual facilitation Graphic facilitation. While the data, pictures and information might change, it was still the same project… year after year,” she said.
Facts are the numbers, the data. So, you make any story about the impact it’s having on people, not on the technology, the data, or the change. Illustrate what you’re trying to get across so people can visualize it. Write the story details down in bullet form: where/when/who/what happened? That’s where you focus.
Facts are the numbers, the data. So, you make any story about the impact it’s having on people, not on the technology, the data, or the change. Illustrate what you’re trying to get across so people can visualize it. Write the story details down in bullet form: where/when/who/what happened? That’s where you focus.
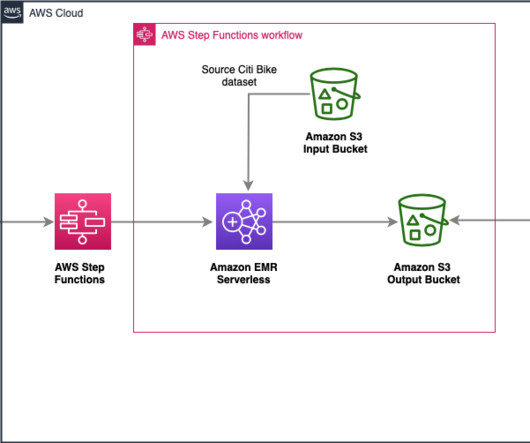
You can run analytics workloads at any scale with automatic scaling that resizes resources in seconds to meet changing data volumes and processing requirements. AWS Step Functions is a serverless orchestration service that enables developers to build visual workflows for applications as a series of event-driven steps.
IT leaders and CIOs have also long recognized the power of storytelling, but only recently has the phenomenon become formalized with many saying they’ve attended workshops or seminars on the topic with the express intention of improving their sense of narrative and power to communicate and persuade. Everybody loves a good story,” he says.
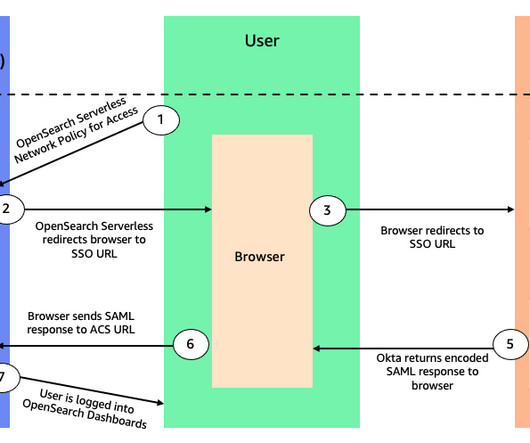
OpenSearch is an open-source search and analytics suite that enables you to ingest, store, analyze, and visualize full text and log data. In this post, you will learn how to use Okta as your IdP and integrate it with OpenSearch Serverless to securely manage your users and groups for secure access to your data.
Processing and analyzing log and Internet of Things (IoT) data can be challenging, especially when dealing with large volumes of real-time data. Elastic and Amazon Kinesis Data Firehose are two powerful tools that can help make this process easier. Integrating Elastic and Kinesis Data Firehose is a straightforward process.
With the rapid growth of technology, more and more data volume is coming in many different formats—structured, semi-structured, and unstructured. Data analytics on operational data at near-real time is becoming a common need. a new version of AWS Glue that accelerates data integration workloads in AWS.
I’m a long-time advocate for adding specificity into data presentation as a way to humanize your message. Specific examples are a way to zoom in to the details while connecting your audience to the big picture ideas. The goal was to use data to drive the discussion on health disparities in our local Nashville community.
As part of our continuing tech investments, CTSI-Global decided to incorporate modern BI technology to help shippers perform advanced forecasting and modeling through elegant and robust visualizations on top of the centralized shipping data we aggregate. Data Complexity. Data Complexity. Automation and Integration.
It comprises a search engine, OpenSearch, which delivers low-latency search and aggregations, OpenSearch Dashboards, a visualization and dashboarding tool, and a suite of plugins that provide advanced capabilities like alerting, fine-grained access control, observability, security monitoring, and vector storage and processing.
But inside every lost account is the data you need to improve and retain future customers. With a customer success dashboard, you can visualize the composition of that churn rate by any demographic you track in your CRM. Here’s where your CS dashboard has helped you make decisions based on data. Who Stays and Who Goes?
I started out as an evaluator and I always loved the data viz side of my job. Reasons Evaluators Should Be Learning About DataVisualization and Reporting. Resources Someone Just Starting Out in Evaluation (and Others) Can Use to Get Proficient in DataVisualization. It’s very detailed and thorough.”
It automatically provisions and scales the underlying resources to deliver fast data ingestion and query responses for even the most demanding and unpredictable workloads. With OpenSearch Serverless, you can configure SAML to enable users to access data through OpenSearch Dashboards using an external SAML identity provider (IdP).
On her podcast, we talked about my unexpected shift from being an evaluator to a datavisualization designer, along with my tips getting started working for yourself or teaching online. That way, each school can view their own data? My specialty, though, is datavisualization. Watch Our Conversation.
I addressed this question on the Data Strategy Show with Samir Sharma. Samir Sharma is a data strategy and analytics leader, CEO and Founder of datazuum. He has a history of helping data executives and leaders craft and execute their data strategies. Challenges Faced by Companies Trying to Visualize Their Data.
Here are my favorite datavisualization resources from the past year. 6 Data Cleaning Steps to Save You Millions : Hudson Kelley teaches us how to check for duplicates; check for changes in the survey instrument; check for outliers; use counts; recode variables with IF statements; and combine datasets with lookups.
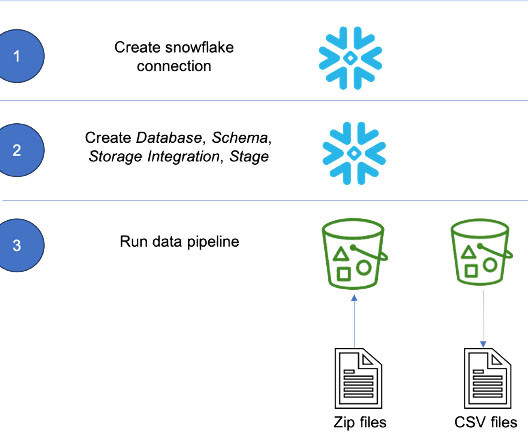
Customers rely on data from different sources such as mobile applications, clickstream events from websites, historical data, and more to deduce meaningful patterns to optimize their products, services, and processes. Apache Airflow and Snowflake have emerged as powerful technologies for data management and analysis.
4 Levels of Excel Vizardry I’ve taught datavisualization in Excel a dozen different ways over the years. I can’t get into the nitty-gritty details hacking Excel to make population pyramids… if someone’s never heard of a population pyramid before. Are you drowning in the deep end of Excel? We start easy.
The bulk of these uncertainties do not revolve around what software package to pick or whether to migrate to the cloud; they revolve around how exactly to apply these powerful technologies and data with precision and control to achieve meaningful improvements in the shortest time possible.
With intentional editing, you can design visualizations that inform and inspire. ” But the general public is craving clear, reliable visuals. Media outlets are reporting that their COVID-19 datavisualizations are their most viewed pages. Clear, concise visuals matter more than ever. New for 2020!
Calendar Simple Spreadsheets , our data analysis course: March 4 – 7, 2024 from 1 – 4:30 pm Eastern each day. Here’s more info about my workshops, which can be held virtually or in-person. In the past, groups have opted to cover qualitative dataviz, maps, before-after graphs, and longitudinal data.
It enables natural language interaction not just with the BI platform itself but also with the underlying data. These agents aim to support not only end users but also power users and business analysts in tasks such as creating visualizations, reports, dashboards, and generating “stories” (compelling data storytelling reports).
There are still not enough data experts out there, even as the world of data evolves rapidly. We started the Summer School for Data Leaders five years ago to create a community for data experts to share ideas and relate to people facing similar challenges. Data ethics is top of mind. The community is growing.
Co-chair Paco Nathan provides highlights of Rev 2 , a data science leaders summit. We held Rev 2 May 23-24 in NYC, as the place where “data science leaders and their teams come to learn from each other.” Nick Elprin, CEO and co-founder of Domino Data Lab. First item on our checklist: did Rev 2 address how to lead data teams?
We organize all of the trending information in your field so you don't have to. Join 42,000+ users and stay up to date on the latest articles your peers are reading.
You know about us, now we want to get to know you!
Let's personalize your content
Let's get even more personalized
We recognize your account from another site in our network, please click 'Send Email' below to continue with verifying your account and setting a password.


Let's personalize your content