This site uses cookies to improve your experience. To help us insure we adhere to various privacy regulations, please select your country/region of residence. If you do not select a country, we will assume you are from the United States. Select your Cookie Settings or view our Privacy Policy and Terms of Use.
Cookie Settings
Cookies and similar technologies are used on this website for proper function of the website, for tracking performance analytics and for marketing purposes. We and some of our third-party providers may use cookie data for various purposes. Please review the cookie settings below and choose your preference.
Used for the proper function of the website
Used for monitoring website traffic and interactions
Cookie Settings
Cookies and similar technologies are used on this website for proper function of the website, for tracking performance analytics and for marketing purposes. We and some of our third-party providers may use cookie data for various purposes. Please review the cookie settings below and choose your preference.
Strictly Necessary: Used for the proper function of the website
Performance/Analytics: Used for monitoring website traffic and interactions
One of those areas is called predictive analytics, where companies extract information from existing data to determine buying patterns and forecast future trends. By using a combination of data, statistical algorithms, and machine learning techniques, predictive analytics identifies the likelihood of future outcomes based on the past.
One of those areas is called predictive analytics, where companies extract information from existing data to determine buying patterns and forecast future trends. By using a combination of data, statistical algorithms, and machine learning techniques, predictive analytics identifies the likelihood of future outcomes based on the past.
With licensing agreements, for instance, revenue must now be recognized upfront, making it difficult to compare current recent financial statements against past statements for the purposes of forecasting and strategic planning. Download our whitepaper Oracle NetSuite: Enhancing Cloud-Based Reporting.
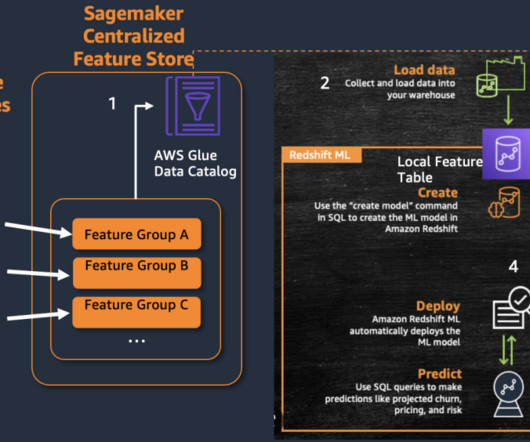
Amazon Redshift is a fast, petabyte-scale, cloud datawarehouse that tens of thousands of customers rely on to power their analytics workloads. To get started, we need an Amazon Redshift Serverless datawarehouse with the Redshift ML feature enabled and an Amazon SageMaker Studio environment with access to SageMaker Feature Store.
.” It falls to cloud data teams and other stakeholders to weigh their options and pick the best products to meet these needs, often holding off on choosing a BI tool until they’ve settled on a cloud-based datawarehouse, even if the platform could help them start evolving their business immediately. Download the guide.
Business Intelligence(BI) is defined as the concept of using modern datawarehouse technology, online analysis and processing technology, data mining and data display technology for data analysis to achieve business value. Free Download. Free Download. Free Download. BI Use case in Real-world.
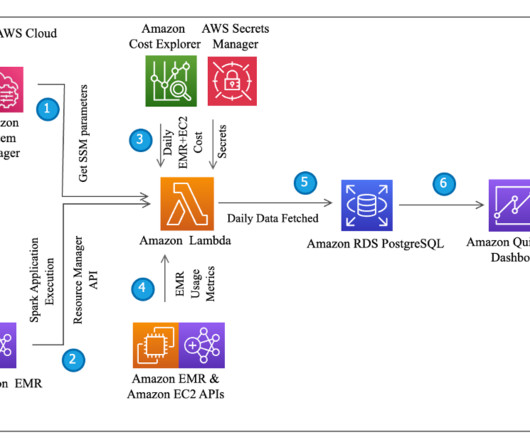
runtime, complete the following steps to create the corresponding layer package for peycopog2 : Download psycopg2_binary-2.9.9-cp39-cp39-manylinux_2_17_x86_64.manylinux2014_x86_64.whl You can collect the metrics for a longer duration to observe trends on the usage of Amazon EMR resources and use that for forecasting purposes.
The company is pointing customers to several other options, including “BYOD” (which stands for “bring your own database”) and Microsoft Azure data lakes. This leads to the second option, which is a datawarehouse. In this scenario, data are periodically queried from the source transactional system.
Over 25,000 organizations worldwide rely on insightsoftware’s portfolio of best-in-class reporting, analytics, budgeting, forecasting, consolidation, and tax solutions to provide them with increased productivity, visibility, accuracy, and compliance. Power BI Without the Risk.
While JD Edwards transactional data is required to run period close reports, analyze trends, and prepare forecasts for planning and budgeting, it comes with a lot of complexity. JD Edwards World has no less than 1600 tables of data to support just its business applications. Download our whitepaper. Each table can be huge.
You can download FineReport for free and have a try! Free Download of FineReport 1. Budget variance quantifies the discrepancy between budgeted and actual figures, enabling forecasters to make more accurate predictions regarding future costs and revenues.
We at AWS recognized the need for a more streamlined approach to data integration, particularly between operational databases and the cloud datawarehouses. It handles various data changes, including updates, inserts, and deletes in the source table and implementing an SCD2 approach.
Cash flow projections (also known as cash flow forecasting ) is the process of estimating and predicting the cash inflows, cash outflows, and cash balance a business can expect over a specific period of time, typically in the short- to medium-term.
Application Imperative: How Next-Gen Embedded Analytics Power Data-Driven Action Download Now While traditional BI has its place, the fact that BI and business process applications have entirely separate interfaces is a big issue. Healthcare is forecasted for significant growth in the near future. percent, and Healthcare, 12.1
Many people use terms like “planning,” “forecasting,” “budgeting,” and “financial projection” somewhat interchangeably. When it comes to a plan vs forecast in particular, the line can be blurry. Let’s look at four key features that distinguish financial planning from forecasting: 1. Access Resource Now.
Executives typically use financial models to make decisions regarding: Budgeting and forecasting. That means the FP&As are the people creating the budget and performing financial forecasting to help the CFO and other members of senior management understand the company’s financial situation. Forecasting Models.
The key components of a data pipeline are typically: Data Sources : The origin of the data, such as a relational database , datawarehouse, data lake , file, API, or other data store. This can include tasks such as data ingestion, cleansing, filtering, aggregation, or standardization.
In most companies, planning, budgeting, and forecasting processes are fairly well-established, but just because you’ve always done things a certain way doesn’t mean you can’t improve them. Monitor, Forecast, and Adjust. The idea of changing your approach to planning, budgeting, and forecasting may seem daunting.
Forward-looking financial documents may include budgets, projections, forecasts, and pro forma financials. In a recent post , we covered the fundamental distinctions between forecasts and projections. Budgeting and forecasting, likewise, are somewhat different. What is a Forecast? So What Exactly is “Budget Forecasting”?
Your KPIs should be a mix of: Leading and lagging metrics : Ensure that you have both predictive (leading) and corrective (lagging) measures to forecast and report performance, respectively. Download Now. To learn more about financial government KPIs and to download a dashboard template, continue reading here.
2025 is forecast to be as impactful as any of the last few years, with continuing advancements in financial and business reporting technology promising to help organizations enhance their operational efficiency and effectiveness. Download the brochure now. Create custom reports in minutes without technical skills or IT expertise.
They help monitor inventory levels, track deliveries, and provide actionable insights about the efficiency of the warehouse or storage facilities. Download Now. Accuracy of Forecast Demand. Forecasting is a crucial part of reporting. Understanding the accuracy of forecast demand can help your operation significantly.
Organizations depend on FP&A teams to provide accurate forecasts that enable continued success. However, recent insightsoftware research has revealed that skills shortages in FP&A teams are slowing processes down and making it harder to deliver accurate forecasts in a timely manner.
Download Now. With a thorough foundation of trends, you’ll be able to forecast growth for the coming months and see your progress and growth with less work involved. Download Now. With that being said, there are other formats in which you can report your data–such as a KPI dashboard. Trend Identification.
Download Now. Reshaping Future Growth: Top Tips on How to Manage Tax Forecasts. Download Now. With these considerable time savings, they can use the product to map out different scenarios with actual and forecasted finance data to make their own strategic suggestions from a tax perspective.
Jet Analytics is a robust Business Intelligence (BI) solution that complements Jet Reports with a datawarehouse and advanced analytics capabilities. It includes pre-built projects, cubes, and data models, as well as a suite of ready-to-run reports and dashboards. Download Now: Click here to access resource.
insightsoftware’s reporting software eliminates the need for manual data processing and puts the organization truly in control of its finances. Download Now. Download Now. Download Now: Click here to access resource. 5 Things Not to do When Choosing a Financial Reporting Tool. Campaign Delivery KPIs for non-profits.
Maximize Your On-Premises Potential Download Now 3. Un-stick Your Data with Real-Time Reporting Traditional reporting methods often include exporting data from your Oracle ERP into a spreadsheet. Addressing these data integration challenges with coherent software strategies can significantly improve efficiency and accuracy.
This empowers you to maximize Microsoft’s enhanced reporting and dashboarding capabilities and derive greater value from your Dynamics and Power BI investment. Read our whitepaper on transforming your Dynamics financial reporting with Atlas to see how you can harness these advancements to drive business success in the coming year and beyond.
The latter is responsible for forecasting sales, then maximizing revenue and margins; the former must see to it that the supply chain operates as efficiently as possible. Instead of developing forecasts that focus solely on demand, the company might look at the bigger picture. Sales Forecasting. Access Resource.
Data Exposure Risks Public AI models require training on external data, exposing sensitive dashboards, proprietary metrics, and client information to unknown entities. With BI, this could mean sharing financial forecasts or customer dataan unthinkable risk.
Top 5 Things to Consider Before Moving to Oracle ERP Cloud Download Now 2. By preparing a detailed roadmap, organizations can anticipate challenges and proactively address them, reducing the likelihood of extended downtime. Leverage Real-Time Reporting for Informed Decisions Effective project-based reporting is crucial during migration.
Additionally, fostering a culture of data literacy by training teams on data standards and best practices ensures that everyone contributes to maintaining a high standard of data integrity, positioning the organization for long-term success. The Simba Story: Advancing Leadership in Data Connectivity Download Now 4.
Download Now. Download Now: Click here to access resource. If you are interested in a free demonstration of how we can help streamline your reporting process, you can contact us here. Top 5 Excel Tips & Tricks Every Finance Manager Should Know. Staffing KPIs for the Modern CEO. How to Build Useful KPI Dashboards.
This includes cleaning, aggregating, enriching, and restructuring data to fit the desired format. Load : Once data transformation is complete, the transformed data is loaded into the target system, such as a datawarehouse, database, or another application.
There’s an old saying in the business world that “All forecasts are wrong.” Consider sales forecasts, for example. Download Now: Click here to access resource. There’s another adage, often repeated by military leaders, that says “no plan of battle ever survives first contact with the enemy.”.
A Compelling Case for Tax Technology Change Download Now Modernizing Your Tax Technology With Longview Tax A modern tax technology ecosystem enables your team to respond faster to new requirements, minimize errors, and improve data accuracy, giving you a proactive stance in tax strategy rather than a reactive one.
Leveraging EPM tools for demand planning and forecasting allows organizations to optimize inventory levels, align production schedules with customer demand, and reduce the risk of leaving distributors and retailers with stockouts or excess inventory. What are the five basic components of supply chain management?
Download Now. Download Now. Download Now: Select Your Closest Time Zone -- Select One -- Business Email *. In your reviews, be sure to discuss the drivers behind every metric in detail. There are many internal and external factors contributing to a trend and understanding them will help you make informed decisions.
Although the workbooks were standardized, data entered were not always complete or in line with numbers forecast earlier in the year. The semi-manual approach to data capture also led to inaccuracies that needed to be managed and corrected centrally. Download Now: Click here to access resource. The Need to Free Up Time.
Download Now. Cash Flow Forecast. Your cash flow forecast, the ultimate goal of cash flow planning, represents cash flow for your company in a given future time period, usually 12 months. Download Now. Download Now: Hidden Select Your Closest Time Zone -- Select One -- Business Email *. Cash Flow Position.
Once your new ERP is in place, financial and operational reporting should have access to uninterrupted data sets and forecasting that draws on a successive, accurate history. Essentially, the data will not give clues that it was ever transported from one system to another. To learn more, download the ERP migration whitepaper.
Download Now: Click here to access resource. If you have any questions about how our reporting solutions can streamline your 2021 reporting process, do not hesitate to contact us here. How to Compare Reporting & BI Solutions. Select Your Closest Time Zone -- Select One -- Business Email *.
Bizview offers an integrated, web-based budgeting, planning, and forecasting solution. With its solid, self-service reporting, dashboards, and analytics, Bizview connects in near real-time to all your data sources. This inability to accurately locate data (such as working capital) leads to business inefficiencies. Smart Move.
We organize all of the trending information in your field so you don't have to. Join 42,000+ users and stay up to date on the latest articles your peers are reading.
You know about us, now we want to get to know you!
Let's personalize your content
Let's get even more personalized
We recognize your account from another site in our network, please click 'Send Email' below to continue with verifying your account and setting a password.


Let's personalize your content