This site uses cookies to improve your experience. To help us insure we adhere to various privacy regulations, please select your country/region of residence. If you do not select a country, we will assume you are from the United States. Select your Cookie Settings or view our Privacy Policy and Terms of Use.
Cookie Settings
Cookies and similar technologies are used on this website for proper function of the website, for tracking performance analytics and for marketing purposes. We and some of our third-party providers may use cookie data for various purposes. Please review the cookie settings below and choose your preference.
Used for the proper function of the website
Used for monitoring website traffic and interactions
Cookie Settings
Cookies and similar technologies are used on this website for proper function of the website, for tracking performance analytics and for marketing purposes. We and some of our third-party providers may use cookie data for various purposes. Please review the cookie settings below and choose your preference.
Strictly Necessary: Used for the proper function of the website
Performance/Analytics: Used for monitoring website traffic and interactions
Enterprise datawarehouse platform owners face a number of common challenges. In this article, we look at seven challenges, explore the impacts to platform and business owners and highlight how a modern datawarehouse can address them. ETL jobs and staging of data often often require large amounts of resources.
In this blog, we will share with you in detail how Cloudera integrates core compute engines including Apache Hive and Apache Impala in Cloudera DataWarehouse with Iceberg. We will publish follow up blogs for other data services. Read why the future of data lakehouses is open.
These lakes power mission critical large scale data analytics, business intelligence (BI), and machine learning use cases, including enterprise datawarehouses. In recent years, the term “data lakehouse” was coined to describe this architectural pattern of tabular analytics over data in the data lake.
These lakes power mission critical large scale data analytics, business intelligence (BI), and machine learning use cases, including enterprise datawarehouses. In recent years, the term “data lakehouse” was coined to describe this architectural pattern of tabular analytics over data in the data lake.
Users today are asking ever more from their datawarehouse. As an example of this, in this post we look at Real Time Data Warehousing (RTDW), which is a category of use cases customers are building on Cloudera and which is becoming more and more common amongst our customers. What is Real Time Data Warehousing?
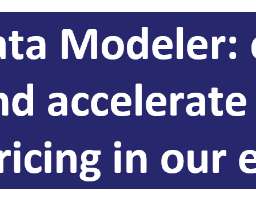
Designing databases for datawarehouses or data marts is intrinsically much different than designing for traditional OLTP systems. Accordingly, data modelers must embrace some new tricks when designing datawarehouses and data marts. Figure 1: Pricing for a 4 TB datawarehouse in AWS.
This cluster runs workloads for every department – from real-time user interfaces for Support to providing recommendations in the Cloudera Data Platform (CDP) Upgrade Advisor to analyzing our business and closing our books. You can learn more about how we moved to CDP [ADD WEBINAR DETAILS]. 24×7 business-critical use cases.
After all, how do you adjust this month’s operations based on last month’s data if it takes two weeks to finally receive the information you need? This is exactly how Octopai customer, Farm Credit Services of America (FCSA) , felt when their BI team needed to modernize their datawarehouse.
On January 4th I had the pleasure of hosting a webinar. It was titled, The Gartner 2021 Leadership Vision for Data & Analytics Leaders. This was for the Chief Data Officer, or head of data and analytics. The fill report is here: Leadership Vision for 2021: Data and Analytics. Link Data to Business Outcomes.
The certification focuses on the seven domains of the analytics process: business problem framing, analytics problem framing, data, methodology selection, model building, deployment, and lifecycle management. The exam consists of 40 questions and the candidate has 120 minutes to complete it. Candidates have 90 minutes to complete the exam.
You will learn all the parts of Cloudera’s Data Platform that together will accelerate your everyday Data Worker tasks. This demo-guided blog aims to inspire further curiosity and learning, as well as fuel a fruitful, interactive dialogue – we welcome you to reach out to us if any particular part piques your interest. .
But, with the amount of time it takes for BI to deliver and the amount of manual data mapping and tracing required to enable accurate delivery, you have to question if maybe BI could be made more intelligent. By unifying different data streams on one platform, a better interpretation of that information is possible. Watch the webinar!
Recently, I gave a Make Your Data Work Monday webinar on the complexities of the data sources for data science in Azure, and I thought it important enough to turn into an actual post. How can you differentiate the different opportunities to store your data in Azure?
Power BI is full of amazing pre-built visualizations, but your business is unique, and so are your data needs. Custom visuals can be used by anyone with the Power BI platform who needs better filtering options, detailed charts, interactive drill-down capabilities, or even industry-specific visuals to improve their dashboards and reports.
To answer this question, I recently joined Anthony Seraphim of Texas Mutual Insurance Company (TMIC) and David Stodder of TDWI on a webinar. The three of us talked migration strategy and the best way to move to the Snowflake Data Cloud. This underscores the importance of having a plan that fits your data strategy.
Around 2011, we worked with a hot gaming company with a real-time analytics use case to understand what their users were doing in the moment to optimize the gaming experience by monitoring how users interacted with the game. To learn more: Watch SingleStore-IBM Webinar. Visit IBM website on SingleStore.
Interactive demo sessions and live Q&A are what we all need these days when working remotely from home is now a norm. NiFi is like the mailman who delivers the data to the mailbox or a different destination. NiFi is a great, consistent, and unique software to manage all your data ingestion.
I was pricing for a data warehousing project with just 4 TBs of data, small by today’s standards. I chose “ON Demand” for up to 64 virtual CPUs and 448 GB of memory since I wanted this datawarehouse to fit entirely, or at least mostly, within memory. Figure 1: Pricing for a 4 TB datawarehouse in AWS.
The question is, how do retailers make the best use of this data to stay ahead of the competition? From the massive amounts of data that are being generated from your digital interactions, retailers have an opportunity to collect this data, along with other information, to effectively identify problems, opportunities and solutions.
IBM Security® Guardium® Data Protection empowers security teams to safeguard sensitive data through discovery and classification, data activity monitoring, vulnerability assessments and advanced threat detection.
Every organization wants to better serve its customers, and that goal is often achieved through data. Again, this means a data culture is about your people, both technical and non-technical. “We We all live in a world where data drives our supply chain,” Lavorini says. Focus on business (not just tech) outcomes.
Watch the webinars : erwin Data Modeling 101-401 for the cloud. Blog: Data Modeling 101: OLTP data modeling, design, and normalization for the cloud. Blog: Data Modeling 201 for the cloud: designing databases for datawarehouses. Related links: Like this blog? Join a group today. Like this blog?
When a Citizen Data Scientist uses these tools, the resulting analysis can be combined with the professional knowledge and specific domain skills of the individual to better understand and gain insight into trends, patterns, issues and opportunities and improve time to market, accuracy of predictions, and metrics and measurements.
I was pricing a data warehousing project with just 4 TB of data – small by today’s standards. I chose “OnDemand” for up to 64 virtual CPUs and 448 GB of memory, since this datawarehouse wanted to leverage in-memory processing. So that’s $136,000 per year just to run this one datawarehouse in the cloud.
Analytics are the gateway to understanding, enabling users to interact with and interpret the insights generated through data collection, preparation, and analysis. With Logi Symphony, equip your users with: Self-Service Analytics to empower non-technical users to interact with data independently. Ready to learn more?
Avoid making important decisions based on outdated data. With interactive reporting technology, you can easily refresh your reports to access real-time data, making financial reporting faster, more efficient, and highly accurate. Catch our on-demand webinar on how to make the best use of your Hubble toolkit.
This is in contrast to traditional BI, which extracts insight from data outside of the app. As rich, data-driven user experiences are increasingly intertwined with our daily lives, end users are demanding new standards for how they interact with their business data. Yes—but basic dashboards won’t be enough.
It’s important for the non-profit organization to know the most effective method for interacting with its unique demographic. This non-profit KPI is comprised of three smaller metrics that should be monitored for optimal effectivity: Applause : This metric is used to measure passive interactions with social media posts.
Hubble integrates your critical business systems so users at all levels can interact with live data and return data with extraordinary speed. Real-time integration with JD Edwards puts you in control with live data so your decisions are based on consistent, reliable, and accurate information. Ready to learn more?
Dynamic Data Visualization for Deeper Insights While older platforms focus on static reports, Logi Symphony enables dynamic, interactive dashboards. Check out our on-demand webinar on how to master pixel-perfect reports with Logi Symphony. Ready to learn more?
By using these metrics with our interactive accounting KPI dashboard, you will easily be able to identify areas for improvement and optimize your 2021 reporting. In this post, we will focus on KPIs for accounting managers to measure performance for accounts payable, accounts receivable and internal accounting departments. Learn More.
Their combined utility makes it easy to create and maintain a complete datawarehouse solution with very little effort. Jet acts as the perfect conduit between your ERP data and Power BI. Jet Analytics provides datawarehouse automation for fast, consistent business analytics and master data management.
These enhancements transform how users access and gain insights from their data. Logi Symphony empowers you to meet business demands and address critical questions with tailored, interactive analyticsall while ensuring compliance with regulatory requirements. Ready to learn more?
Encryption ensures that sensitive data remains unreadable and protected from unauthorized access during data integration and transfer processes. Restricted access to specific data sources, reports, or dashboards ensures that only authorized personnel can view and interact with sensitive financial information.
You want to give users in your application access to seamlessly embedded analytics that offers personalized self-service and interactivity. Or it might be too simple for others who prefer to interact with and analyze data to uncover new insights on their own. Go to market sooner so you can set yourself apart.
This approach allows you and your customers to harness the full potential of your data, transforming it into interactive, AI-driven conversations that can significantly enhance user engagement and insight discovery. Chatflows ensure every interaction is personal and relevant, transforming data queries into engaging conversations.
You will also slowly start to see more buy in from these people into your data processes from eliminating silos and interacting. Stubborn adherence to Excel represents an assumption that all your stakeholders have the skills to interact with data in that format. Spoiler alert: they don’t.
This includes tools for effortless data preparation, allowing them to jump right into analysis. Customizable dashboards with drag-and-drop functionality and interactive features empower users to personalize their experience and uncover deeper insights. Basic reporting is no longer enough. Ready to learn more?
And if you’re looking to leverage the power of AI to manage customer relationships, Deltek Vantagepoint uses AI to summarize client information, giving teams a bird’s-eye view of client interactions and status. With more efficient client relationship monitoring, your team can improve client relationships and potentially gain more projects.
We see the same analytics challenges time and time again: Disjointed user experience — A lack of customization and functionality prevents your users from viewing data in a way that satisfies their needs. Limited self-service and interactivity features may not match the skill levels of those that use them.
The classroom offers users the chance to explore and understand Qlik’s features and tools at their own pace, via interactivewebinars, hands-on exercises, and even quizzes to test their knowledge. The Qlik Learning Portal offers a Self-Paced Learning virtual classroom that you can try for free.
BigQuery Integration for Enhanced Big Data Capabilities Big data is an incredibly valuable asset for your users, but extracting value from it often involves navigating complex processes and incurring extra costs. Watch our on-demand webinar on unlocking the power of AI in Logi Symphony. Ready to learn more?
This approach allows you and your customers to harness the full potential of your data, transforming it into interactive, AI-driven conversations that can significantly enhance user engagement and insight discovery. Chatflows ensure every interaction is personal and relevant, transforming data queries into engaging conversations.
By democratizing data access, self-service analytics fosters a culture of agility and innovation, empowering businesses to respond quickly to market shifts and customer demands. To truly transform how your business harnesses data, you need a powerhouse solution designed to meet these needs head-on. Want to learn more?
We organize all of the trending information in your field so you don't have to. Join 42,000+ users and stay up to date on the latest articles your peers are reading.
You know about us, now we want to get to know you!
Let's personalize your content
Let's get even more personalized
We recognize your account from another site in our network, please click 'Send Email' below to continue with verifying your account and setting a password.


Let's personalize your content