Remove Data Warehouse Remove Metrics Remove Presentation Remove Snapshot
article thumbnail

Power enterprise-grade Data Vaults with Amazon Redshift – Part 2

AWS Big Data

Amazon Redshift is a popular cloud data warehouse, offering a fully managed cloud-based service that seamlessly integrates with an organization’s Amazon Simple Storage Service (Amazon S3) data lake, real-time streams, machine learning (ML) workflows, transactional workflows, and much more—all while providing up to 7.9x

article thumbnail

Financial Dashboard: Definition, Examples, and How-tos

FineReport

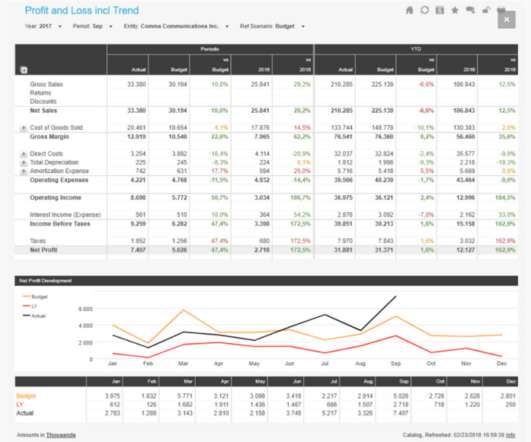
A financial dashboard, one of the most important types of data dashboards , functions as a business intelligence tool that enables finance and accounting teams to visually represent, monitor, and present financial key performance indicators (KPIs). You can download FineReport for free and have a try! Free Download of FineReport 1.

Insiders

Sign Up for our Newsletter

This site is protected by reCAPTCHA and the Google Privacy Policy and Terms of Service apply.

article thumbnail

Unlock scalability, cost-efficiency, and faster insights with large-scale data migration to Amazon Redshift

AWS Big Data

Large-scale data warehouse migration to the cloud is a complex and challenging endeavor that many organizations undertake to modernize their data infrastructure, enhance data management capabilities, and unlock new business opportunities. This makes sure the new data platform can meet current and future business goals.

article thumbnail

Migrate Amazon Redshift from DC2 to RA3 to accommodate increasing data volumes and analytics demands

AWS Big Data

Dafiti’s data infrastructure relies heavily on ETL and ELT processes, with approximately 2,500 unique processes run daily. Amazon Redshift at Dafiti Amazon Redshift is a fully managed data warehouse service, and was adopted by Dafiti in 2017. TB of data. We started with 115 dc2.large

article thumbnail

What is business intelligence? Transforming data into business insights

CIO Business Intelligence

BI tools access and analyze data sets and present analytical findings in reports, summaries, dashboards, graphs, charts, and maps to provide users with detailed intelligence about the state of the business. The potential use cases for BI extend beyond the typical business performance metrics of improved sales and reduced costs.

article thumbnail

Dimensional modeling in Amazon Redshift

AWS Big Data

Amazon Redshift is a fully managed and petabyte-scale cloud data warehouse that is used by tens of thousands of customers to process exabytes of data every day to power their analytics workload. You can structure your data, measure business processes, and get valuable insights quickly can be done by using a dimensional model.

article thumbnail

Accelerate Moving to CDP with Workload Manager

Cloudera

Performance metrics appear in charts and graphs. . In this blog, we walk through the Impala workloads analysis in iEDH, Cloudera’s own Enterprise Data Warehouse (EDW) implementation on CDH clusters. We compare the current run of a job to a baseline derived from performance metrics. Self-serve data (no burden on IT).