This site uses cookies to improve your experience. To help us insure we adhere to various privacy regulations, please select your country/region of residence. If you do not select a country, we will assume you are from the United States. Select your Cookie Settings or view our Privacy Policy and Terms of Use.
Cookie Settings
Cookies and similar technologies are used on this website for proper function of the website, for tracking performance analytics and for marketing purposes. We and some of our third-party providers may use cookie data for various purposes. Please review the cookie settings below and choose your preference.
Used for the proper function of the website
Used for monitoring website traffic and interactions
Cookie Settings
Cookies and similar technologies are used on this website for proper function of the website, for tracking performance analytics and for marketing purposes. We and some of our third-party providers may use cookie data for various purposes. Please review the cookie settings below and choose your preference.
Strictly Necessary: Used for the proper function of the website
Performance/Analytics: Used for monitoring website traffic and interactions
In this blog, we will share with you in detail how Cloudera integrates core compute engines including Apache Hive and Apache Impala in Cloudera DataWarehouse with Iceberg. We will publish follow up blogs for other data services. Iceberg basics Iceberg is an open table format designed for large analytic workloads.
With this new functionality, customers can create up-to-date replicas of their data from applications such as Salesforce, ServiceNow, and Zendesk in an Amazon SageMaker Lakehouse and Amazon Redshift. SageMaker Lakehouse gives you the flexibility to access and query your data in-place with all Apache Iceberg compatible tools and engines.
Large-scale datawarehouse migration to the cloud is a complex and challenging endeavor that many organizations undertake to modernize their data infrastructure, enhance data management capabilities, and unlock new business opportunities. This makes sure the new data platform can meet current and future business goals.
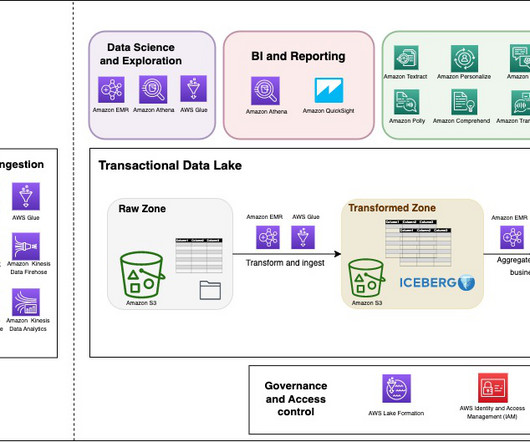
They enable transactions on top of data lakes and can simplify data storage, management, ingestion, and processing. These transactional data lakes combine features from both the data lake and the datawarehouse. The Data Catalog provides a central location to govern and keep track of the schema and metadata.
The extract, transform, and load (ETL) process has been a common pattern for moving data from an operational database to an analytics datawarehouse. ELT is where the extracted data is loaded as is into the target first and then transformed. ETL and ELT pipelines can be expensive to build and complex to manage.
Data Science works best with a high degree of data granularity when the data offers the closest possible representation of what happened during actual events – as in financial transactions, medical consultations or marketing campaign results. Integration Features.
It automatically provisions and intelligently scales datawarehouse compute capacity to deliver fast performance, and you pay only for what you use. Just load your data and start querying right away in the Amazon Redshift Query Editor or in your favorite business intelligence (BI) tool. Ashish Agrawal is a Sr.
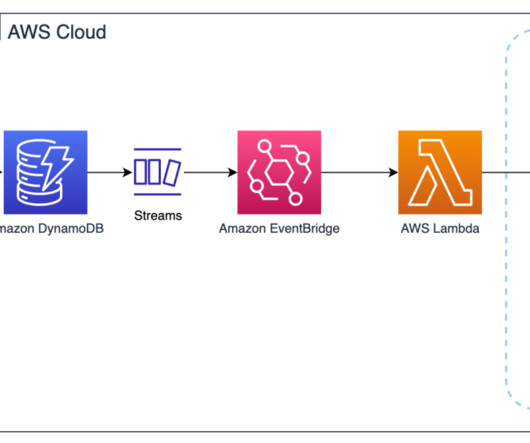
There are two broad approaches to analyzing operational data for these use cases: Analyze the data in-place in the operational database (e.g. With Aurora zero-ETL integration with Amazon Redshift, the integration replicates data from the source database into the target datawarehouse.
They’re static snapshots of a diagram at some point in time. Data Modeling with erwin Data Modeler. a technology manager , uses erwin Data Modeler (erwin DM) at a pharma/biotech company with more than 10,000 employees for their enterprise datawarehouse. This is live and dynamic.”. George H.,
Can Amazon RDS for Db2 be used for running data warehousing workloads? Answer : Yes, Amazon RDS for Db2 can support analytics workloads, but it is not a datawarehouse. Amazon RDS At what level are snapshot-based backups taken? Also, you can take manual snapshots as needed.
dbt is an open source, SQL-first templating engine that allows you to write repeatable and extensible data transforms in Python and SQL. dbt is predominantly used by datawarehouses (such as Amazon Redshift ) customers who are looking to keep their data transform logic separate from storage and engine.
Amazon Redshift is a fully managed and petabyte-scale cloud datawarehouse that is used by tens of thousands of customers to process exabytes of data every day to power their analytics workload. You can structure your data, measure business processes, and get valuable insights quickly can be done by using a dimensional model.
Take a snapshot of your customer database for the past 2 years and it may look like this: That is an average. Let's say I am a car insurance company, or a subscription publisher, with a desire to sort out some of tomorrow's problems today. If you're more comfortable with 6 months or 18 months, then go for it!
The Analytics specialty practice of AWS Professional Services (AWS ProServe) helps customers across the globe with modern data architecture implementations on the AWS Cloud. Table data storage mode – There are two options: Historical – This table in the data lake stores historical updates to records (always append).
After a job ends, WM gets information about job execution from the Telemetry Publisher, a role in the Cloudera Manager Management Service. In this blog, we walk through the Impala workloads analysis in iEDH, Cloudera’s own Enterprise DataWarehouse (EDW) implementation on CDH clusters. Data Engineering jobs (optional).
Given the importance of data in the world today, organizations face the dual challenges of managing large-scale, continuously incoming data while vetting its quality and reliability. We discuss two common strategies to verify the quality of publisheddata. The metadata of an Iceberg table stores a history of snapshots.
It has been well published since the State of DevOps 2019 DORA Metrics were published that with DevOps, companies can deploy software 208 times more often and 106 times faster, recover from incidents 2,604 times faster, and release 7 times fewer defects. Ricardo Serafim is a Senior AWS Data Lab Solutions Architect.
Originally published on December 9th, 2022. Amazon Redshift is a fully managed, petabyte scale cloud datawarehouse that enables you to analyze large datasets using standard SQL. Amazon Redshift is a cloud-based datawarehouse that supports many recovery capabilities to address unforeseen outages and minimize downtime.
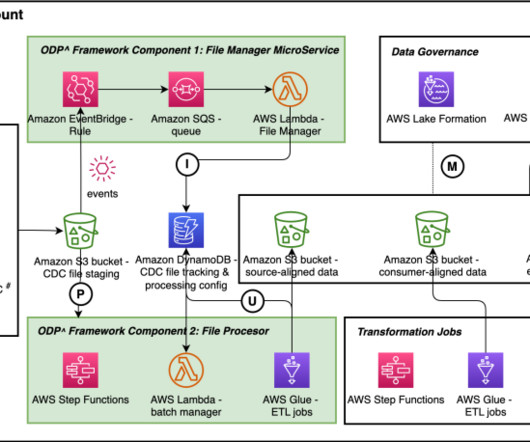
Change Data Capture (CDC) in the context of a data lake refers to the process of capturing and propagating changes made to source data. Source systems often lack the capability to publishdata that is modified or changed. Karthikeyan Ramachandran is a Data Architect with AWS Professional Services.
The answer depends on your specific business needs and the nature of the data you are working with. Both methods have advantages and disadvantages: Replication involves periodically copying data from a source system to a datawarehouse or reporting database. The alternative to BICC is BI Publisher (BIP).
That might be a sales performance dashboard for your Chief Revenue Officer, a snapshot of “days sales outstanding” (DSO) for the A/R collections team, or an item sales trend analysis for product management. With the CXO DataWarehouse Adapter, you can access ERP data, planning and budgeting numbers, or external information.
Here are the burdens facing your team with on-premises ERP solutions: Too complex: ERP data models are complex and difficult to integrate with other ERPs, BI tools, and cloud datawarehouses. Changes made to a data model often require technical support including, but not limited to, a forced reboot of connected applications.
What’s even worse is that these kinds of errors are often overlooked until after an erroneous report has been presented to management or published to an external audience. Every time you do an export from your ERP system, you’re taking a snapshot of the data that only reflects a single moment in time.
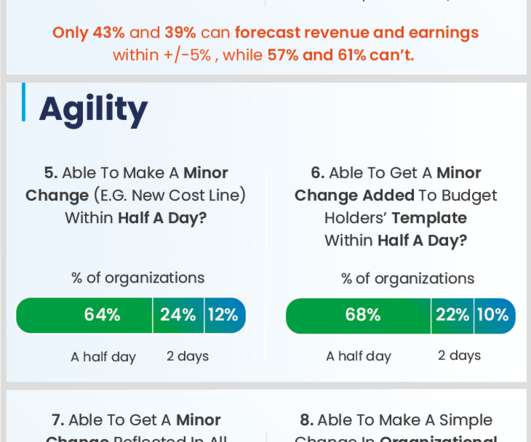
Here is a snapshot of how agile corporate forecasting is. Only 43 percent of organizations can forecast revenue to within plus or minus five percent, and 80 percent cannot forecast beyond a year. Fifty-two percent are unable to look out further than six months. FSN Global Survey 2021: Agility in Planning, Budgeting and Forecasting.
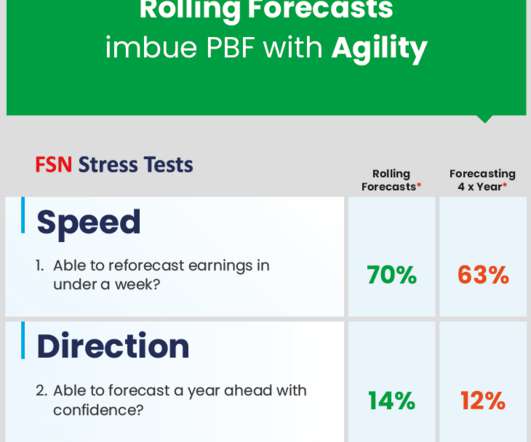
Here is a snapshot of how PBF is performing in organizations adopting rolling forecasts. However, rolling forecasts are not something you can create and manage in spreadsheets. So, to realize the benefits, you need to invest in modern software with built-in “smarts” that handle the complexities of rolling forecasts for you.
If you’re still reporting manually, it’s easy to run into disadvantages like these: Error-Prone Spreadsheets: Manual data entry and complex spreadsheet formulas increase the risk of human error, leading to inaccurate reporting and unreliable financial data. This lack of trust in the data can hinder strategic decision-making.
All of that in-between work–the export, the consolidation, and the cleanup–means that analysts are stuck using a snapshot of the data. Perhaps just as importantly, they lead to a time delay between the moment something happens in the business and the time it shows up on a report. Manual Processes Are Prone to Errors.
There is yet another problem with manual processes: the resulting reports only reflect a snapshot in time. As soon as you export data from your ERP software or other business systems, it’s obsolete.
The source data in this scenario represents a snapshot of the information in your ERP system. Researching that question requires substantial additional effort if your organization uses manual planning and budgeting processes. It’s not updated when someone records new transactions, and you can’t drill down to the details.
Project status reports are critical to see a snapshot of where projects are from a task level. For example: Resource reports are useful for engineers and consultants to identify bottlenecks preventing projects from completing on time. Despite their broad nature, leadership can also use them to drill down on details.
Microsoft Excel offers flexibility, but it’s missing so many of the elements required to assemble data quickly and easily for powerful (and accurate) financial narratives. The reports created within static spreadsheets are based on a snapshot of reality, taken the moment the data was exported from ERP.
Microsoft Excel offers flexibility, but it’s missing so many of the elements required to assemble data quickly and easily for powerful (and accurate) financial narratives. The reports created within static spreadsheets are based on a snapshot of reality, taken the moment the data was exported from ERP.
And that is only a snapshot of the benefits your finance users will enjoy with Angles for Deltek. Angles has been effective to providing us real-time financial and operational data that otherwise we would have to manually parse together. Tools to configure custom views for the remaining 20% of your team’s operational reporting needs.
We organize all of the trending information in your field so you don't have to. Join 42,000+ users and stay up to date on the latest articles your peers are reading.
You know about us, now we want to get to know you!
Let's personalize your content
Let's get even more personalized
We recognize your account from another site in our network, please click 'Send Email' below to continue with verifying your account and setting a password.


Let's personalize your content