This site uses cookies to improve your experience. To help us insure we adhere to various privacy regulations, please select your country/region of residence. If you do not select a country, we will assume you are from the United States. Select your Cookie Settings or view our Privacy Policy and Terms of Use.
Cookie Settings
Cookies and similar technologies are used on this website for proper function of the website, for tracking performance analytics and for marketing purposes. We and some of our third-party providers may use cookie data for various purposes. Please review the cookie settings below and choose your preference.
Used for the proper function of the website
Used for monitoring website traffic and interactions
Cookie Settings
Cookies and similar technologies are used on this website for proper function of the website, for tracking performance analytics and for marketing purposes. We and some of our third-party providers may use cookie data for various purposes. Please review the cookie settings below and choose your preference.
Strictly Necessary: Used for the proper function of the website
Performance/Analytics: Used for monitoring website traffic and interactions
Amazon Redshift is a fast, scalable, secure, and fully managed cloud datawarehouse that you can use to analyze your data at scale. Whether you’re a data engineer, an analyst generating reports, or working on any other stateful data, understanding how to use Data API session reuse is worth exploring.
Migrating a data fulfillment center (i.e. warehouse). Your datawarehouse is not too different from an Amazon fulfillment center. No one wants to disrupt this level of complexity in order to recreate it elsewhere. Your old datawarehouse has become deprecated. Ready to take on the job?
Interestingly, you can address many of them very effectively with a datawarehouse. It’s a much more complicated matter to recreate the history, showing which payments were applied to which invoices in which amounts. For example, it would be useful to retain the capability of reporting historical sales trends.
Reporting will change in D365 F&SCM, and those changes could significantly increase complexity and total cost of ownership. To enhance security, Microsoft has decided to restrict that kind of direct database access in D365 F&SCM and replace it with an abstraction layer comprised of something called “data entities”.
During that same time, AWS has been focused on helping customers manage their ever-growing volumes of data with tools like Amazon Redshift , the first fully managed, petabyte-scale cloud datawarehouse. From 2019 to now, Wang reports the amount of data the company holds has grown by a factor of 20.
At these times, they run business growth reports, shareholder reports, and financial reports for their earnings calls, to name a few examples. Cloud deployments for suitable workloads gives you the agility to keep pace with rapidly changing business and data needs.
Part of this challenge is that many organizations seek to align their data science workflows to data warehousing patterns and practices. This means trading off granularity and latency of data for structures that make it easier to write queries that aggregate, filter and group results for reporting purposes.
Financial reporting is much more specialised. Financial Reporting: Not a Fit for BI. Financial reporting needs cannot be solved by a BI implementation, mainly because transactional drill-down and real-time data demands are not supported in any reports produced by BI tools. DataWarehouse? Sounds good?
All of that data puts a load on even the most powerful equipment. Reports and models stutter as they try to interpret the massive amounts of data flowing through them. If you’re not careful, your engineers’ data requirements may overwhelm your computers’ capacity. Can’t get to the data.
Does your organization’s success depend on immediate delivery of new reports, applications, or projects? While cloud-native, point-solution datawarehouse services may serve your immediate business needs, there are dangers to the corporation as a whole when you do your own IT this way. Do you need faster time to value?
Data lakes are more focused around storing and maintaining all the data in an organization in one place. And unlike datawarehouses, which are primarily analytical stores, a data hub is a combination of all types of repositories—analytical, transactional, operational, reference, and data I/O services, along with governance processes.
In this post, we share how FanDuel moved from a DC2 nodes architecture to a modern Amazon Redshift architecture, which includes Redshift provisioned clusters using RA3 instances , Amazon Redshift data sharing , and Amazon Redshift Serverless. Their individual, product-specific, and often on-premises datawarehouses soon became obsolete.
Synapse services are powerful tools for bringing data together for analytics, machine learning, reporting needs, and more. Here, we discuss technology solutions that help you leverage the benefits of synapse services for mission-critical financial analysis and reporting in Microsoft Dynamics. Streamline Data with Atlas.
Business intelligence (BI) tools are part of the furniture in many organisations, especially when it comes to sharing and visualising data. Finance teams’ reporting needs are too specialised for modern BI tools, so finance needs something different. What’s So Special about Financial Reporting?
Watsonx.data will allow users to access their data through a single point of entry and run multiple fit-for-purpose query engines across IT environments. Through workload optimization an organization can reduce datawarehouse costs by up to 50 percent by augmenting with this solution. [1]
Despite nearly $1 billion in online revenue in 2020, the web-based outdoor recreational retailer was running its entire business on an outdated and unsupported e-commerce platform called ADT. It got the basic job done but the company’s executive leadership team (ELT) knew it was time for a transformation.
This allows data scientists, engineers and data management teams to have the right level of access to effectively perform their role. Each AMP consists of a working prototype for a ML use case together with a research report. Model reproducibility is the extent to which a model can be recreated.
Allocate Adequate Time and Budget For Reports. Companies implementing a new ERP system may spend as much as 25% of their total budget developing reports. With all the other tasks required to make an ERP implementation or upgrade successful, the added burden of migrating reports makes matters even worse.
After observing this system for a few months,” he continues, “Hughes allowed the process to run automatically and report on the implemented changes. These AI agents are serving both internal users and clients, says Daniel Avancini, the company’s chief data officer. We use the same review process for any new enhancements.”
As she observed, these days, “everybody is a data generator and consumer. Millennials are changing the way we consume and reportdata, so a generational change is starting to make a difference regarding the importance of training.
Seventy-six percent of companies prioritize AI and machine learning (ML) over other IT initiatives, according to Algorithmia’s 2021 enterprise trends in machine learning report. With growing pressure on data scientists, every organization needs to ensure that their teams are empowered with the right tools. The bar for AI keeps rising.
A modern data architecture enables companies to ingest virtually any type of data through automated pipelines into a data lake, which provides highly durable and cost-effective object storage at petabyte or exabyte scale. A new view has to be created (or recreated) for reading changes from new snapshots.
For example, one company let all its data scientists access and make changes to their data tables for report generation, which caused inconsistency and cost the company significantly. The best way to avoid poor data quality is having a strict data governance system in place. Enterprise Big Data Strategy.
Data-as-a-Service (DaaS) streamlines the chaos of ungoverned data pipelines and reporting silos created by users who are eager to use data, whether they are simple data inquiries from business analysts to more complex data questions from data science teams. How does DaaS fit into this architecture?
Accounting is the process of recording, analyzing and reporting financial information of a business which can be used by a variety of stakeholders including regulators, investors and management. Reliable Data – KPIs are only as good as the data that are used as inputs. How to Build Useful KPI Dashboards. Learn More.
In more layman terms, public sector KPIs serve two important purposes: They report important information to citizens. The constituents cannot hold their government responsible without having access to periodic reporting on key performance metrics. How to Compare Reporting & BI Solutions. Learn More. Download Now.
How do you ensure greater efficiency and accuracy for your financial reports? Here are five ways you can improve finance reporting efficiency, backed by our recent research into Oracle-driven finance teams. Embrace Finance Automation Oracle-driven finance teams contend with a wide range of automated financial reporting needs.
Leading and lagging metrics : Leading measures predict future performance, whereas lagging measures report past performance. Unfortunately, preparing financial reports is a tedious and costly task. Most organizations either pay consultants to create expensive custom reports or dedicate the majority of their workforce to this job.
Some KPIs are too detailed to be reported to top management, and some KPIs are too general for middle managers and supervisors. Leading indicators predict performance whereas lagging indicators report on it. Clean up your data! Working with incomplete or outdated data could seriously jeopardize your KPI program.
In recent years, investors have been placing an increased emphasis on a range of environmental, social, and governance (ESG) issues resulting in ESG reporting becoming more important. As a result, there are more demands on companies to report on their activities and practices and how they impact environmental and social sustainability.
Though the software offers several advantages over previous versions, finance teams using Microsoft D365BC may experience some challenges in the areas of operational and financial reporting. One general Microsoft D365BC reporting challenge comes from the ERP’s complex data table structure.
Reports to your board must be accurate, timely, and thorough. Effective board packets provide a combination of numbers, visual features, and a narrative summary that helps readers better understand the context and nuance surrounding the information in the report. Your selection of the right board reporting software is essential.
Finance teams must often harmonize and consolidate financial reports across multiple legal entities , often based in different countries and operating with different functional currencies. Adoption has proceeded apace, with 120 countries now having chosen IFRS as their standard for corporate financial reporting. Inventory Valuation.
5 Things Not to do When Choosing a Financial Reporting Tool. insightsoftware’s reporting software provides your hospital with a fast, flexible, and inexpensive tool that automates financial reports. How to Compare Reporting & BI Solutions. These ratios are expressed as a percentage. Learn More.
When a company moves from a traditional on premise ERP system to a multi-tenant cloud product such as Microsoft Dynamics 365 Business Central (D365 BC) , there are usually some fundamental changes to the way you generate reports. You can do whatever you want with it, because no one else stores their data there.
How to Compare Reporting & BI Solutions. The Time Spent by the Organization on Tax Compliance and Financial Reporting: This KPI for the tax department is used to track the resources spent by a company on compliance and reporting. This process is best streamlined using a reporting solution. Centralized Data.
could be included inside the KPI for a more insightful report. Now that we have gone through quite a few university KPIs, we should talk about how you are going to manage all this data. Why You Should Use a KPI Dashboard/Reporting Software. KPI Dashboards Cluster all the Insightful Data in One Place. Download Now.
This article will outline the key financial, operation, and staffing performance indicators that a CEO should be tracking in 2021, as well as the benefits of tracking these using a dashboard to streamline the reporting process. Compiling the data and reporting them. 5 Things Not to do When Choosing a Financial Reporting Tool.
As SAP’s primary ERP solution evolves, customers must be mindful that making the move to S/4HANA will likely impact the way they use reporting and analytics tools. Let’s begin with an overview of the reporting tools that SAP provides for its current ERP offering. An Overview of SAP S/4HANA Reporting Tools.
Most traditional financial reporting processes consume valuable time and money. Choosing the right financial reporting software will ensure that you don’t waste your resources manually crunching numbers or duplicating information. 5 Things Not to do When Choosing a Financial Reporting Tool. Download Now.
There are many ways in which your business can conduct a month-end close process–whether it be using financial reporting software, excel sheets, or an actual ledger book–but what’s important is that you cover all procedures effectively and precisely. How can Financial Reporting Software Help with Month-End Close Procedures?
Data quality has always been at the heart of financial reporting , but with rampant growth in data volumes, more complex reporting requirements and increasingly diverse data sources, there is a palpable sense that some data, may be eluding everyday data governance and control. Access Resource.
If you are looking for more sample financial models in Excel , insightsoftware has a large number of sample reports that you can download. This can sometimes make it difficult for the FP&A department as they are having to gather financial data from multiple entities and compile it into a single model.
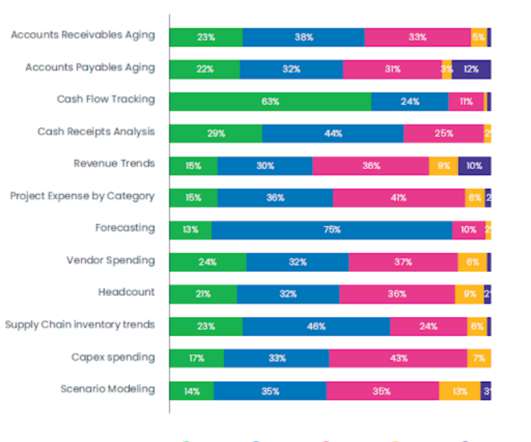
Eighty-nine percent of financial professionals across multiple geographies and industries are dissatisfied with their operational reporting tools. What Is Operational Reporting? We queried 500 finance decision-makers across multiple regions and industries to understand the operational reporting landscape. Microsoft Power BI.
We organize all of the trending information in your field so you don't have to. Join 42,000+ users and stay up to date on the latest articles your peers are reading.
You know about us, now we want to get to know you!
Let's personalize your content
Let's get even more personalized
We recognize your account from another site in our network, please click 'Send Email' below to continue with verifying your account and setting a password.


Let's personalize your content