This site uses cookies to improve your experience. To help us insure we adhere to various privacy regulations, please select your country/region of residence. If you do not select a country, we will assume you are from the United States. Select your Cookie Settings or view our Privacy Policy and Terms of Use.
Cookie Settings
Cookies and similar technologies are used on this website for proper function of the website, for tracking performance analytics and for marketing purposes. We and some of our third-party providers may use cookie data for various purposes. Please review the cookie settings below and choose your preference.
Used for the proper function of the website
Used for monitoring website traffic and interactions
Cookie Settings
Cookies and similar technologies are used on this website for proper function of the website, for tracking performance analytics and for marketing purposes. We and some of our third-party providers may use cookie data for various purposes. Please review the cookie settings below and choose your preference.
Strictly Necessary: Used for the proper function of the website
Performance/Analytics: Used for monitoring website traffic and interactions
Talend is a data integration and management software company that offers applications for cloud computing, big data integration, application integration, data quality and master data management. Its code generation architecture uses a visual interface to create Java or SQL code.
In todays data-driven world, securely accessing, visualizing, and analyzing data is essential for making informed business decisions. For instance, a global sports gear company selling products across multiple regions needs to visualize its sales data, which includes country-level details.
Data lakes and datawarehouses are two of the most important data storage and management technologies in a modern data architecture. Data lakes store all of an organization’s data, regardless of its format or structure. Delta Lake doesn’t have a specific concept for incremental queries.
Domo is best known as a business intelligence (BI) and analytics software provider, thanks to its functionality for visualization, reporting, data science and embedded analytics. Domo made several significant announcements at its recent Domopalooza customer event in Salt Lake City.
There are countless examples of big data transforming many different industries. It can be used for something as visual as reducing traffic jams, to personalizing products and services, to improving the experience in multiplayer video games. We would like to talk about datavisualization and its role in the big data movement.
This means you can refine your ETL jobs through natural follow-up questionsstarting with a basic data pipeline and progressively adding transformations, filters, and business logic through conversation. The DataFrame code generation now extends beyond AWS Glue DynamicFrame to support a broader range of data processing scenarios.
However, computerization in the digital age creates massive volumes of data, which has resulted in the formation of several industries, all of which rely on data and its ever-increasing relevance. Data analytics and visualization help with many such use cases. It is the time of big data. Select a Storage Platform.
BI architecture has emerged to meet those requirements, with data warehousing as the backbone of these processes. One of the BI architecture components is data warehousing. Each of that component has its own purpose that we will discuss in more detail while concentrating on data warehousing. Data integration.
Unified access to your data is provided by Amazon SageMaker Lakehouse , a unified, open, and secure data lakehouse built on Apache Iceberg open standards. The final model provides sales teams with the highest-value opportunities, which they can visualize in a business intelligence dashboard and take action on immediately.
This article proposes a methodology for organizations to implement a modern data management function that can be tailored to meet their unique needs. By modern, I refer to an engineering-driven methodology that fully capitalizes on automation and software engineering best practices.
Although organizations spend millions of dollars on collecting and analyzing data with various data analysis tools , it seems like most people have trouble actually using that data in actionable, profitable ways. Your Chance: Want to perform advanced data analysis with a few clicks? 3) Where will your data come from?
Try our professional reporting software for 14 days, completely free! Ad hoc reporting, also known as one-time ad hoc reports, helps its users to answer critical business questions immediately by creating an autonomous report, without the need to wait for standard analysis with the help of real-time data and dynamic dashboards.
Collaborate and build faster using familiar AWS tools for model development, generative AI, data processing, and SQL analytics with Amazon Q Developer , the most capable generative AI assistant for software development, helping you along the way. The tools to transform your business are here.
1) Benefits Of Business Intelligence Software. a) Data Connectors Features. For a few years now, Business Intelligence (BI) has helped companies to collect, analyze, monitor, and present their data in an efficient way to extract actionable insights that will ensure sustainable growth. Benefits Of Business Intelligence Software.
Customers often want to augment and enrich SAP source data with other non-SAP source data. Such analytic use cases can be enabled by building a datawarehouse or data lake. Customers can now use the AWS Glue SAP OData connector to extract data from SAP. Choose Visual ETL to create a job in the Visual Editor.
Business leaders, developers, data heads, and tech enthusiasts – it’s time to make some room on your business intelligence bookshelf because once again, datapine has new books for you to add. We have already given you our top datavisualization books , top business intelligence books , and best data analytics books.
To simplify things, you can think of back-end BI skills as more technical in nature and related to building BI platforms, like online datavisualization tools. Front-end analytical and business intelligence skills are geared more towards presenting and communicating data to others. What Are the First Steps To Getting Started?
DataOps needs a directed graph-based workflow that contains all the data access, integration, model and visualization steps in the data analytic production process. It orchestrates complex pipelines, toolchains, and tests across teams, locations, and data centers. Meta-Orchestration . Production Monitoring Only.
QuickSight makes it straightforward for business users to visualizedata in interactive dashboards and reports. QuickSight periodically runs Amazon Athena queries to load query results to SPICE and then visualize the latest metric data. The filtered Worker Utilization per Job visualization shows 0.5,
Your Chance: Want to test a social media dashboard software for free? A social media dashboard is an invaluable management tool that is used by professionals, managers, and companies to gather, optimize, and visualize important metrics and data from social channels such as Facebook, Twitter, LinkedIn, Instagram, YouTube, etc.
BI analysts, with an average salary of $71,493 according to PayScale , provide application analysis and data modeling design for centralized datawarehouses and extract data from databases and datawarehouses for reporting, among other tasks. Organization: Microsoft. Exam fee: $165.
We realized we needed a datawarehouse to cater to all of these consumer requirements, so we evaluated Amazon Redshift. At the same time, we had to find a way to implement entitlements in our Amazon Redshift datawarehouse with the same set of tags that we had already defined in Lake Formation.
Complex queries, on the other hand, refer to large-scale data processing and in-depth analysis based on petabyte-level datawarehouses in massive data scenarios. The combination of these three services provides a powerful, comprehensive solution for end-to-end data lineage analysis.
Without real-time insight into their data, businesses remain reactive, miss strategic growth opportunities, lose their competitive edge, fail to take advantage of cost savings options, don’t ensure customer satisfaction… the list goes on. Try our professional BI software for 14 days, completely free! Actually, it usually isn’t.
These past BI issues may discourage them to adopt enterprise-wide BI software. Without further ado, here are the top 10 challenges of business intelligence in today’s digital world and how you can use modern software to tackle these issues. SMEs are discouraged by the prohibitive costs of acquiring the right software.
A DSS leverages a combination of raw data, documents, personal knowledge, and/or business models to help users make decisions. The data sources used by a DSS could include relational data sources, cubes, datawarehouses, electronic health records (EHRs), revenue projections, sales projections, and more.
Specific business intelligence technologies may include: ad hoc analysis Data querying & discovery Datawarehouse Enterprise reporting Datavisualization Dashboards. Datawarehouse. The datawarehouse is a core component of business intelligence technologies. Datavisualization.
It provides insights and metrics related to the performance and effectiveness of data quality processes. In this post, we highlight the seamless integration of Amazon Athena and Amazon QuickSight , which enables the visualization of operational metrics for AWS Glue Data Quality rule evaluation in an efficient and effective manner.
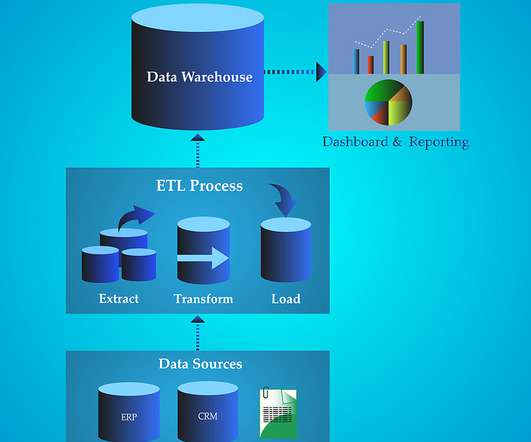
The ETL process is defined as the movement of data from its source to destination storage (typically a DataWarehouse) for future use in reports and analyzes. The data is initially extracted from a vast array of sources before transforming and converting it to a specific format based on business requirements.
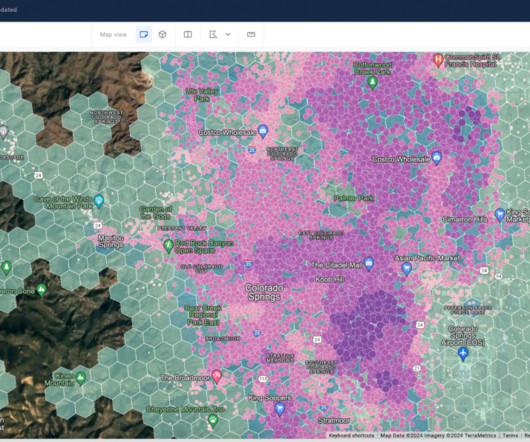
However, visualizing and analyzing large-scale geospatial data presents a formidable challenge due to the sheer volume and intricacy of information. This often overwhelms traditional visualization tools and methods. Figure 1 – Map built with CARTO Builder and the native support to visualize H3 indexes What are spatial indexes?
Data architect role Data architects are senior visionaries who translate business requirements into technology requirements and define data standards and principles, often in support of data or digital transformations. In some ways, the data architect is an advanced data engineer.
In his classic work, the Visual Display of Quantitative Information , Edward R. Tufte powerfully illustrates the impact that datavisualization can have on real-world decisions. He provides a second example in which the absence of datavisualization leads to the opposite outcome.
Investment in datawarehouses is rapidly rising, projected to reach $51.18 billion by 2028 as the technology becomes a vital cog for enterprises seeking to be more data-driven by using advanced analytics. Datawarehouses are, of course, no new concept. More data, more demanding. “As
Big data is usually associated with high volume, high velocity and high variety information, and tends to deal with datasets that are too complex for other, more traditional data processing software. What is big data used for? What is Big Data?” What is Google BigQuery? References.
But the benefits of BI extend beyond business decision-making, according to datavisualization vendor Tableau , including the following: Data-driven business decisions: The ability to drive business decisions with data is the central benefit of BI.
Business intelligence (BI) analysts transform data into insights that drive business value. This is done by mining complex data using BI software and tools , comparing data to competitors and industry trends, and creating visualizations that communicate findings to others in the organization.
In 2013, Amazon Web Services revolutionized the data warehousing industry by launching Amazon Redshift , the first fully-managed, petabyte-scale, enterprise-grade cloud datawarehouse. Amazon Redshift made it simple and cost-effective to efficiently analyze large volumes of data using existing business intelligence tools.
Worse yet, poor data management can lead managers to make decisions based on faulty assumptions. Data, Data, and More Data. Much of this challenge arises from the proliferation of systems, such as ERP, CRM, e-commerce, or specialized industry-specific software. Self-Service Reporting and DataVisualization.
AWS Glue has made this more straightforward with the launch of AWS Glue job observability metrics , which provide valuable insights into your data integration pipelines built on AWS Glue. With Grafana, you can create, explore, and share visually rich, data-driven dashboards. Graph lines are visualized per job.
Analytics and data are becoming an integral part of every software product and every company. 5 Advantages of Using a Redshift DataWarehouse. Whatever business you’re in, your company is becoming a data company. That means you need to put all that data somewhere. D3 DataVisualization ?—
With quality data at their disposal, organizations can form datawarehouses for the purposes of examining trends and establishing future-facing strategies. Industry-wide, the positive ROI on quality data is well understood. Business/Data Analyst: The business analyst is all about the “meat and potatoes” of the business.
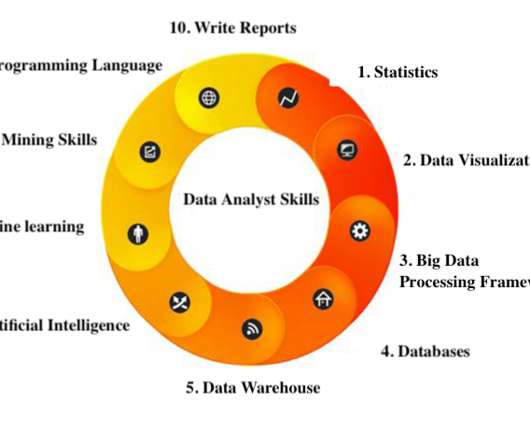
Berdasarkan pengalaman saya secara bertahun-tahun, saya merangkum sepuluh skill yang perlu dikuasai seorang data analyst senior dan memiliki kualifikasi. Software Pemvisualisasi Data: excel, python, software profesional lainnya. Framework Big Data Processing: Hadoop, storm, spark. Data Warehous: SSIS, SSAS.
Among the many reasons that a majority of large enterprises have adopted Cloudera DataWarehouse as their modern analytic platform of choice is the incredible ecosystem of partners that have emerged over recent years. We are tracking very interesting development in areas like security, catalogs, data masking and more.
BI software helps companies do just that by shepherding the right data into analytical reports and visualizations so that users can make informed decisions. Axel Goris, global visual analytics lead, Novartis Novartis There can be obstacles, however, to taking the self-service approach.
We organize all of the trending information in your field so you don't have to. Join 42,000+ users and stay up to date on the latest articles your peers are reading.
You know about us, now we want to get to know you!
Let's personalize your content
Let's get even more personalized
We recognize your account from another site in our network, please click 'Send Email' below to continue with verifying your account and setting a password.


Let's personalize your content