This site uses cookies to improve your experience. To help us insure we adhere to various privacy regulations, please select your country/region of residence. If you do not select a country, we will assume you are from the United States. Select your Cookie Settings or view our Privacy Policy and Terms of Use.
Cookie Settings
Cookies and similar technologies are used on this website for proper function of the website, for tracking performance analytics and for marketing purposes. We and some of our third-party providers may use cookie data for various purposes. Please review the cookie settings below and choose your preference.
Used for the proper function of the website
Used for monitoring website traffic and interactions
Cookie Settings
Cookies and similar technologies are used on this website for proper function of the website, for tracking performance analytics and for marketing purposes. We and some of our third-party providers may use cookie data for various purposes. Please review the cookie settings below and choose your preference.
Strictly Necessary: Used for the proper function of the website
Performance/Analytics: Used for monitoring website traffic and interactions
In today’s data-driven world, organizations rely on data analysts to interpret complex datasets, uncover actionable insights, and drive decision-making. Enter the DataAnalysis Agent, to automate analytical tasks, execute code, and adaptively respond to data queries.
With just a few lines of code, you can tap into the vast knowledge […] The post Revamp DataAnalysis: OpenAI, LangChain & LlamaIndex for Easy Extraction appeared first on Analytics Vidhya.
For all the tasks related to data science and machine learning, the most important thing that defines how a model will perform depends on how good our data is. Python Pandas and SQL are among the powerful tools that can help in extracting and manipulating data efficiently.
Introduction In the area of academic research, the journey from raw data to insightful conclusions can be daunting if you’re a beginner or novice. However, with the right approach and tools, transforming data into meaningful knowledge is an immensely rewarding experience.
It's quite a process for marketing teams to develop a long-term data management strategy. It involves finding a data management provider that can append contacts with correct information — in real-time. Not just that, but also ongoing data hygiene efforts to keep the incoming (and existing) information fresh.
Now, imagine a world where […] The post All About AI-powered DataAnalysis with Vizly appeared first on Analytics Vidhya. It has become a part of every major sector, from tech and healthcare to finance and entertainment, and continues transforming our work.
This feature […] The post ChatGPT’s Code Interpreter: GPT-4 Advanced DataAnalysis for Data Scientists appeared first on Analytics Vidhya. One of the most exciting features of ChatGPT is its ability to generate code snippets in various programming languages, including Python, Java, JavaScript, and C++.
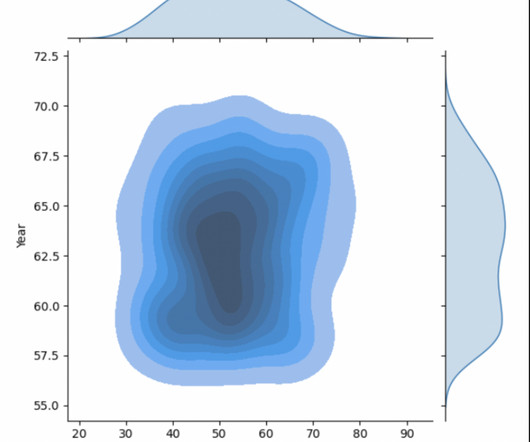
Introduction Exploratory DataAnalysis (EDA) is a process of describing the data by means of statistical and visualization techniques in order to bring important aspects of that data into focus for further analysis. appeared first on Analytics Vidhya.
This article investigates the […] The post Guide on Integrating Azure Services for Enhanced Data Management & Analysis appeared first on Analytics Vidhya. From new businesses to expansive endeavors, engineers leverage Azure to upgrade their applications with the control of cloud innovation and manufactured insights.
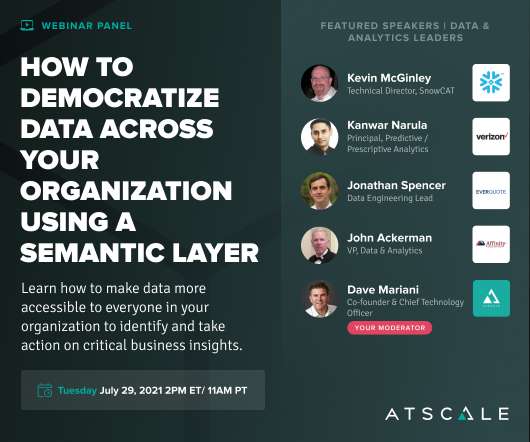
Speaker: speakers from Verizon, Snowflake, Affinity Federal Credit Union, EverQuote, and AtScale
Join this webinar panel for practical advice on how to build and foster a data literate, self-service analysis culture at scale using a semantic layer. In this webinar you will learn about: Making data accessible to everyone in your organization with their favorite tools.
Handling missing data is one of the most common challenges in dataanalysis and machine learning. Missing values can arise for various reasons, such as errors in data collection, manual omissions, or even the natural absence of information. appeared first on Analytics Vidhya.
Discretization is a fundamental preprocessing technique in dataanalysis and machine learning, bridging the gap between continuous data and methods designed for discrete inputs.
Data summarization is an essential first step in any dataanalysis workflow. While Pandas’ describe() function has been a go-to tool for many, its functionality is limited to numeric data and provides only basic statistics.
A large number of high-level decisions and subsequent actions are based on the dataanalysis modern economies cannot exist without. Regardless of whether you are yet to get your first Data Analyst Interview Questions or you are keen on revising your skills in the job market, the process of learning can be rather challenging.
Gen AI is a game changer for busy salespeople and can reduce time-consuming tasks, such as customer research, note-taking, and writing emails, and provide insightful dataanalysis and recommendations. This frees up valuable time for sellers to focus more on building relationships and closing deals.
The Race For Data Quality In A Medallion Architecture The Medallion architecture pattern is gaining traction among data teams. It is a layered approach to managing and transforming data. By systematically moving data through these layers, the Medallion architecture enhances the data structure in a data lakehouse environment.
Amazon DataZone now launched authentication supports through the Amazon Athena JDBC driver, allowing data users to seamlessly query their subscribed data lake assets via popular business intelligence (BI) and analytics tools like Tableau, Power BI, Excel, SQL Workbench, DBeaver, and more.
Language models have transformed how we interact with data, enabling applications like chatbots, sentiment analysis, and even automated content generation. However, most discussions revolve around large-scale models like GPT-3 or GPT-4, which require significant computational resources and vast datasets.
DataFrames are one of the most popular data structures for handling and analyzing tabular data in data science and analytics. Python libraries like pandas provide robust tools for working with DataFrames, allowing data manipulation, transformation, and visualization.
Introduction Envision a reality where data is not just an array of figures but a tool that serves as the blueprint for all management decisions. In this ever-changing environment, the data analyst becomes crucial. They convert raw data into usable analysis.
Introduction Imagine you’re working on a dataset to build a Machine Learning model and don’t want to spend too much effort on exploratory dataanalysis codes. You may sometimes find it confusing to sort, filter, or group data to obtain the required information.
Introduction Nominal data is one of the most fundamental types of data in dataanalysis. This article examines nominal data’s characteristics, applications, and differences from other data types. Overview What is Nominal Data? appeared first on Analytics Vidhya.
Speaker: Speakers from SafeGraph, Facteus, AWS Data Exchange, SimilarWeb, and AtScale
Data and analytics leaders across industries can benefit from leveraging multiple types of diverse external data for making smarter business decisions. Data and analytics specialists from AWS Data Exchange and AtScale will walk through exactly how to blend and operationalize these diverse data external and internal sources.
Efficient decision-making is the result of combining information, analysis, and effectiveness. That’s why businesses of all types and sizes are embracing data visualization, albeit often with a simplified approach. Power BI and Tableau, popular and user-friendly data visualization tools, help businesses organize large datasets.
A Drug Launch Case Study in the Amazing Efficiency of a Data Team Using DataOps How a Small Team Powered the Multi-Billion Dollar Acquisition of a Pharma Startup When launching a groundbreaking pharmaceutical product, the stakes and the rewards couldnt be higher. data engineers delivered over 100 lines of code and 1.5
Introduction The availability of information is vital in today’s data-driven environment. For many uses, such as competitive analysis, market research, and basic data collection for analysis, efficiently extracting data from websites is crucial.
Introduction In business, financial analysis and reporting are critical for strategic decision-making and operational oversight. Traditionally, financial reporting and analysis have been time-consuming, requiring expertise to interpret complex data and generate actionable business intelligence.
you’ll see what we mean in this eBook) more revenue through data-driven prospecting, stage analysis, and subsequent sales enablement. This eBook highlights best practices for developing a pipeline management process that helps sales leaders and their team C.L.O.S.E
One of the points that I look at is whether and to what extent the software provider offers out-of-the-box external data useful for forecasting, planning, analysis and evaluation. Until recently, it was adequate for organizations to regard external data as a nice to have item, but that is no longer the case.
Whether you’re involved in an experiment, simulations, dataanalysis or using machine learning, calculating square roots in Python is crucial. In this guide, you […] The post Python Square Root appeared first on Analytics Vidhya.
Introduction Mathematics is a way of uncovering possible insights or information from data as done in the field of Data Science. So data science is a vast and a type of mixed field of statistical analysis, computer science, and domain expertise.
They can be applied to dataanalysis, customer service, content creation, and other areas. Introduction LLMs are changing how we engage with technology today. These AI programs are able to comprehend and mimic human language. But for newcomers in particular, knowing how to use them could appear challenging.
Speaker: David Loshin, President, Knowledge Integrity, Inc, and Sharon Graves, Enterprise Data - BI Tools Evangelist, GoDaddy
Traditional data governance fails to address how data is consumed and how information gets used. As a result, organizations are failing to effectively share and leverage data assets. To meet the needs of the business and the growing number of data consumers, many organizations like GoDaddy are rebooting data governance.
Introduction Large language models (LLMs) have revolutionized natural language processing (NLP), enabling various applications, from conversational assistants to content generation and analysis. However, working with LLMs can be challenging, requiring developers to navigate complex prompting, data integration, and memory management tasks.
Introduction Tableau is a powerful data visualization tool that is crucial in Data Science. Its significance lies in its ability to transform complex data into easily understandable visualizations, aiding in better decision-making processes. Its Application and Benefits in Data Science appeared first on Analytics Vidhya.
Introduction In the realm of dataanalysis and manipulation, Excel remains a powerhouse tool. Among its many features, the TRANSPOSE function stands out for its ability to reorganize data quickly and efficiently.
Introduction While Tableau remains a popular choice for data visualization, its dominance is waning. The increasing importance of dataanalysis across industries has fueled the demand for versatile tools, leading to a surge in Tableau alternatives.
An organization’s data is copied for many reasons, namely ingesting datasets into data warehouses, creating performance-optimized copies, and building BI extracts for analysis. Read this whitepaper to learn: Why organizations frequently end up with unnecessary data copies.
Introduction Spreadsheets are essential tools for dataanalysis, but complex formulas can hold you back. That’s where Claude for Sheets, a revolutionary AI add-on from Anthropic, comes in. Ask questions directly in your spreadsheet and get insightful answers using natural language.
ipynb files) are widely used for dataanalysis, scientific computing, and interactive coding. While these notebooks are great for development and sharing code with other data scientists, there are times when you need to convert them to a more universally readable format like PDF. Introduction Jupyter Notebooks (.ipynb
Introduction Microsoft Excel and Google Sheets are two of the most basic and commonly used tools for dataanalysis. They offer various built-in functions that help in making statistical computations in every industry. One such function is the CONFIDENCE function. This formula calculates the confidence intervals for a sample dataset.
Introduction Statistical Analysis of text is one of the important steps of text pre-processing. It helps us understand our text data in a deep, mathematical way. This type of analysis can help us understand hidden patterns, and the weight of specific words in a sentence, and overall, helps in building good language models.
An interactive guide filled with the tools to turn your data into a competitive advantage. They rely on data to power products, business insights, and marketing strategy. We’ve created this interactive playbook to help you use your data to provide actionable insights that will lead to better business decisions and customer outcomes.
We organize all of the trending information in your field so you don't have to. Join 42,000+ users and stay up to date on the latest articles your peers are reading.
You know about us, now we want to get to know you!
Let's personalize your content
Let's get even more personalized
We recognize your account from another site in our network, please click 'Send Email' below to continue with verifying your account and setting a password.


Let's personalize your content