This site uses cookies to improve your experience. To help us insure we adhere to various privacy regulations, please select your country/region of residence. If you do not select a country, we will assume you are from the United States. Select your Cookie Settings or view our Privacy Policy and Terms of Use.
Cookie Settings
Cookies and similar technologies are used on this website for proper function of the website, for tracking performance analytics and for marketing purposes. We and some of our third-party providers may use cookie data for various purposes. Please review the cookie settings below and choose your preference.
Used for the proper function of the website
Used for monitoring website traffic and interactions
Cookie Settings
Cookies and similar technologies are used on this website for proper function of the website, for tracking performance analytics and for marketing purposes. We and some of our third-party providers may use cookie data for various purposes. Please review the cookie settings below and choose your preference.
Strictly Necessary: Used for the proper function of the website
Performance/Analytics: Used for monitoring website traffic and interactions
Introduction Still stuck in the era of manual data management? Imagine a world where your data not only compiles and organizes itself but also generates insights with the power of Artificial Intelligence (AI). It’s time to let the machines take over.
Introduction Welcome, data enthusiasts and aspiring Power BI professionals! If you’re gearing up for a Power BI interview, you’re probably aware of the dynamic nature of the businessintelligence world.
This article was published as a part of the Data Science Blogathon Introduction This article will introduce you to the Spotfire BusinessIntelligence tool for creating interactive visualization, performing data analysis, and data science. Spotfire a major player in the BI space is a product from TIBCO.
Introduction Are you a passionate data professional exploring new tools? Try Metabase, an open-source BusinessIntelligence (BI) tool for creating interactive dashboards from large datasets. Discover the power of Metabase in this guide tailored for data professionals.
The world of data analytics is changing fast as organizations look to gain competitive advantages through the application of timely data. You’ll learn: The evolution of businessintelligence. How do you differentiate one solution from the next? 4 common approaches to analytics for your application.
This article was published as a part of the Data Science Blogathon. Introduction on Data Warehousing In today’s fast-moving business environment, organizations are turning to cloud-based technologies for simple data collection, reporting, and analysis. It […].
Data warehousing, businessintelligence, data analytics, and AI services are all coming together under one roof at Amazon Web Services. It combines SQL analytics, data processing, AI development, data streaming, businessintelligence, and search analytics.
In today’s data-driven world, large enterprises are aware of the immense opportunities that data and analytics present. Yet, the true value of these initiatives is in their potential to revolutionize how data is managed and utilized across the enterprise. Take, for example, a recent case with one of our clients.
Domo is best known as a businessintelligence (BI) and analytics software provider, thanks to its functionality for visualization, reporting, data science and embedded analytics. Facilitating self-service data analytics was an early design goal for Domo, providing the company with differentiation compared to many of its rivals.
Speaker: Jay Allardyce, Deepak Vittal, Terrence Sheflin, and Mahyar Ghasemali
As we look ahead to 2025, businessintelligence and data analytics are set to play pivotal roles in shaping success. Understanding these trends is not only essential to staying ahead of the curve, but critical for those striving to remain competitive and innovative in an increasingly data-driven world.
Introduction The STAR schema is an efficient database design used in data warehousing and businessintelligence. It organizes data into a central fact table linked to surrounding dimension tables. A major advantage of the STAR […] The post How to Optimize Data Warehouse with STAR Schema?
Once the province of the data warehouse team, data management has increasingly become a C-suite priority, with data quality seen as key for both customer experience and business performance. But along with siloed data and compliance concerns , poor data quality is holding back enterprise AI projects.
The Race For Data Quality In A Medallion Architecture The Medallion architecture pattern is gaining traction among data teams. It is a layered approach to managing and transforming data. By systematically moving data through these layers, the Medallion architecture enhances the data structure in a data lakehouse environment.
At one point, analytics and businessintelligence were considered non-mission critical activities. More than 9 in 10 participants in our Analytics and Data Benchmark Research reported analytics had improved activities and processes. But today, analytical systems are integral to many aspects of operations.
In the rapidly-evolving world of embedded analytics and businessintelligence, one important question has emerged at the forefront: How can you leverage artificial intelligence (AI) to enhance your application’s analytics capabilities?
I previously explained that data observability software has become a critical component of data-driven decision-making. Data observability addresses one of the most significant impediments to generating value from data by providing an environment for monitoring the quality and reliability of data on a continual basis.
I recently described how businessdata catalogs are evolving into dataintelligence catalogs. These catalogs combine technical and business metadata and data governance capabilities with knowledge graph functionality to deliver a holistic, business-level view of data production and consumption.
Data governance has always been a critical part of the data and analytics landscape. However, for many years, it was seen as a preventive function to limit access to data and ensure compliance with security and data privacy requirements. Data governance is integral to an overall dataintelligence strategy.
This article was published as a part of the Data Science Blogathon. This self-service businessintelligence tool is the latest and greatest in the data-driven industry. It eased the workaround for attaining data from several sources and consolidating it into one management […].
While data platforms, artificial intelligence (AI), machine learning (ML), and programming platforms have evolved to leverage big data and streaming data, the front-end user experience has not kept up. Traditional BusinessIntelligence (BI) aren’t built for modern data platforms and don’t work on modern architectures.
This article was published as a part of the Data Science Blogathon. PowerBI is used for Businessintelligence. What is equally important here is the ability to communicate the data and insights from your predictive models through reports and dashboards.
The observability of data and the insights derived will allow us to continually evolve and grow while keeping our fans at the top of our game, he adds. In terms of analytics and data management, he adds, it was in 2010 when the Magic first began to see their potential, and Riola was there from day one of the initial partnership with SAS.
Introduction Tableau has emerged as a popular data visualization tool in companies, making it one of the hottest trends in BusinessIntelligence. In India, people are curious about the Tableau developer salary statistics.
” I’ve called out the data field’s rebranding efforts before; but even then, I acknowledged that these weren’t just new coats of paint. Each time, the underlying implementation changed a bit while still staying true to the larger phenomenon of “Analyzing Data for Fun and Profit.”
Think your customers will pay more for data visualizations in your application? Five years ago they may have. But today, dashboards and visualizations have become table stakes. Discover which features will differentiate your application and maximize the ROI of your embedded analytics. Brought to you by Logi Analytics.
With data analysis, visualization, interpretation, and businessintelligence skills, setting your foot and heading over others requires consistency, practice, and an innovative mindset. Among numerous available exciting career choices, Power BI developer is one of the intriguing career options among professionals.
In my perspective on decision intelligence , I lamented the fact that businessintelligence technologies have left the rest of the exercise to the reader for too long. Making a decision is a process that involves many steps and many people.
Traditionally, financial reporting and analysis have been time-consuming, requiring expertise to interpret complex data and generate actionable businessintelligence. These processes provide senior management and stakeholders with key insights into a company’s performance, financial health, and future prospects.
Business leaders may be confident that their organizations data is ready for AI, but IT workers tell a much different story, with most spending hours each day massaging the data into shape. Theres a perspective that well just throw a bunch of data at the AI, and itll solve all of our problems, he says.
We interviewed 16 experts across businessintelligence, UI/UX, security and more to find out what it takes to build an application with analytics at its core. Embedding dashboards, reports and analytics in your application presents unique opportunities and poses unique challenges.
Data architecture definition Data architecture describes the structure of an organizations logical and physical data assets, and data management resources, according to The Open Group Architecture Framework (TOGAF). An organizations data architecture is the purview of data architects. Curate the data.
Introduction Enterprises here and now catalyze vast quantities of data, which can be a high-end source of businessintelligence and insight when used appropriately. Delta Lake allows businesses to access and break new data down in real time.
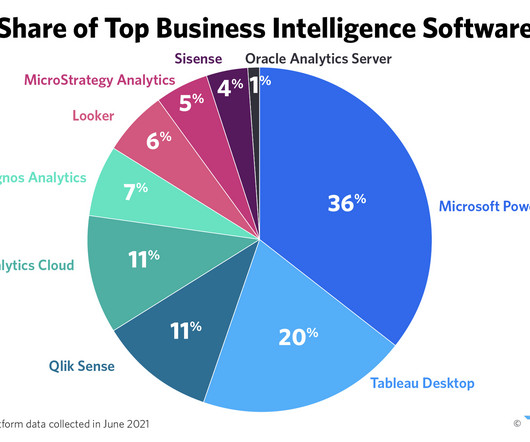
In today’s fast-paced business landscape, making informed decisions is essential for the success of organizations. Understanding popular businessintelligence tools and their unique features is crucial for harnessing their true potential. However, determining the best choice depends on specific requirements.
This article was published as a part of the Data Science Blogathon. With QlikView, you can analyze and visualize data and their relationships and use these analyzes to make decisions. It Supports various data sources, including […]. It Supports various data sources, including […].
Speaker: Marius Moscovici, CEO Metric Insights & Mike Smitheman, VP Metric Insights
While the proper governance of data is clearly critical to the success of any businessintelligence organization, focusing on data governance alone is a huge mistake. To be effective, BusinessIntelligence (BI) governance must cover both data and visualizations.
For container terminal operators, data-driven decision-making and efficient data sharing are vital to optimizing operations and boosting supply chain efficiency. Together, these capabilities enable terminal operators to enhance efficiency and competitiveness in an industry that is increasingly data driven.
In todays economy, as the saying goes, data is the new gold a valuable asset from a financial standpoint. A similar transformation has occurred with data. More than 20 years ago, data within organizations was like scattered rocks on early Earth.
Amazon DataZone now launched authentication supports through the Amazon Athena JDBC driver, allowing data users to seamlessly query their subscribed data lake assets via popular businessintelligence (BI) and analytics tools like Tableau, Power BI, Excel, SQL Workbench, DBeaver, and more.
If I had a magic wand, I would want to add scenario evaluation to all businessintelligence tools on the market. I have previously written about the need to make intelligent decisions with decision intelligence. Analyzing historical data to understand what happened and why it happened is a very mature market segment.
Large enterprises face unique challenges in optimizing their BusinessIntelligence (BI) output due to the sheer scale and complexity of their operations. Unlike smaller organizations, where basic BI features and simple dashboards might suffice, enterprises must manage vast amounts of data from diverse sources.
To achieve this, they aimed to break down data silos and centralize data from various business units and countries into the BMW Cloud Data Hub (CDH). However, the initial version of CDH supported only coarse-grained access control to entire data assets, and hence it was not possible to scope access to data asset subsets.
From customer service chatbots to marketing teams analyzing call center data, the majority of enterprises—about 90% according to recent data —have begun exploring AI. For companies investing in data science, realizing the return on these investments requires embedding AI deeply into business processes.
The need to integrate diverse data sources has grown exponentially, but there are several common challenges when integrating and analyzing data from multiple sources, services, and applications. First, you need to create and maintain independent connections to the same data source for different services.
Amazon Redshift is a fast, scalable, secure, and fully managed cloud data warehouse that makes it simple and cost-effective to analyze your data using standard SQL and your existing businessintelligence (BI) tools. Data ingestion is the process of getting data to Amazon Redshift.
Speaker: David Loshin, President, Knowledge Integrity, Inc, and Sharon Graves, Enterprise Data - BI Tools Evangelist, GoDaddy
Traditional data governance fails to address how data is consumed and how information gets used. As a result, organizations are failing to effectively share and leverage data assets. To meet the needs of the business and the growing number of data consumers, many organizations like GoDaddy are rebooting data governance.
We organize all of the trending information in your field so you don't have to. Join 42,000+ users and stay up to date on the latest articles your peers are reading.
You know about us, now we want to get to know you!
Let's personalize your content
Let's get even more personalized
We recognize your account from another site in our network, please click 'Send Email' below to continue with verifying your account and setting a password.


Let's personalize your content