This site uses cookies to improve your experience. To help us insure we adhere to various privacy regulations, please select your country/region of residence. If you do not select a country, we will assume you are from the United States. Select your Cookie Settings or view our Privacy Policy and Terms of Use.
Cookie Settings
Cookies and similar technologies are used on this website for proper function of the website, for tracking performance analytics and for marketing purposes. We and some of our third-party providers may use cookie data for various purposes. Please review the cookie settings below and choose your preference.
Used for the proper function of the website
Used for monitoring website traffic and interactions
Cookie Settings
Cookies and similar technologies are used on this website for proper function of the website, for tracking performance analytics and for marketing purposes. We and some of our third-party providers may use cookie data for various purposes. Please review the cookie settings below and choose your preference.
Strictly Necessary: Used for the proper function of the website
Performance/Analytics: Used for monitoring website traffic and interactions
TL;DR: Enterprise AI teams are discovering that purely agentic approaches (dynamically chaining LLM calls) dont deliver the reliability needed for production systems. A shift toward structured automation, which separates conversational ability from business logic execution, is needed for enterprise-grade reliability.
In enterprises, we’ve seen everything from wholesale adoption to policies that severely restrict or even forbid the use of generative AI. As of November 2023: Two-thirds (67%) of our survey respondents report that their companies are using generative AI. And only 33% report that their companies aren’t using AI at all.
O’Reilly’s Generative AI in the Enterprise survey reported that people have trouble coming up with appropriate enterprise use cases for AI. Learn from their experience to help put AI to work in your enterprise. 3:02 : AI is easy to demo, but hard to productize. Why is it hard to come up with appropriate use cases?
The mathematics was sound, the demos impressive, yet adoption faltered because little thought was given as to how sellers should use this information. Repetitive tasks such as compiling account reviews or scheduling demos are obvious targets for automation. Subsequent products tried to be prescriptive rather than predictive.
Before the COVID-19 pandemic, many enterprise architects were focused on standardization. By evaluating and deploying the right combination of cloud-based platforms and security tools, enterprise architects played a key role in keeping businesses up and running in a remote-work world. Responding to a Crisis.
Even before the coronavirus disrupted supply chains and shifted priorities, business leaders understood the need to identify and monitor the factors that could have an impact on their enterprises. When you put powerful self-service reporting tools into the hands of the finance team, that becomes possible. Compliance Risk.
The results showed that (among those surveyed) approximately 90% of enterprise analytics applications are being built on tabular data. What could be faster and easier than on-prem enterprise data sources? using high-dimensional data feature space to disambiguate events that seem to be similar, but are not).
Solving real-world discovery challenges In large, enterprise-scale environments, discovering the right dataset often hinges on pinpointing specific technical identifiers. Accelerate productivity across data roles Analysts, stewards, and engineers can find what they need fasterreducing delays in reporting, validation, and development cycles.
After assessment of the source SQL files, it generates a comprehensive report that provides valuable insights into the migration effort. Contact BladeBridge through Request demo and obtain an Analyzer key for your organization. Review the report thoroughly, because it provides a summary and in-depth explanations of the SQL analysis.
Content includes reports, documents, articles, presentations, visualizations, video, and audio representations of the insights and knowledge that have been extracted from data. And AI can help users find the appropriate data that they need from across the enterprise. AI can help business users extract and produce (i.e.,
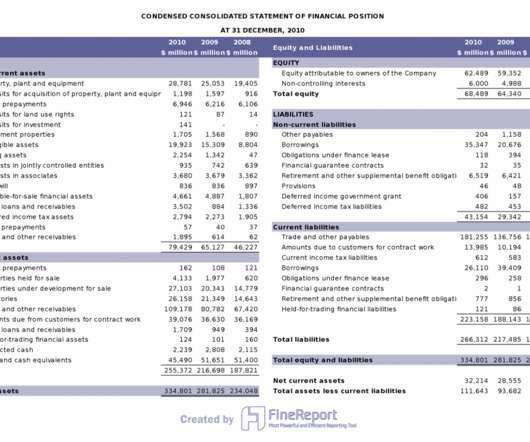
One of the most common channels for companies to provide financial performance transparency is accounting reports. This article starts with the accounting report’s definition and meaning and then lists the company’s three most important accounting reports. What are Accounting Reports? Income statement.
User interfaces for ERP reporting tools are most often built with IT staff in mind, not the end user. As a heavyweight in the world on enterprise software, Oracle makes a lot of companies scramble any time it decides to stop supporting one of its core products. Real-Time Reporting Solutions for Oracle EBS. What Comes Next?
The terms “reporting” and “analytics” are often used interchangeably. In fact there are some very important differences between the two, and understanding those distinctions can go a long way toward helping your organization make best use of both financial reporting and analytics. Financial Reporting.
The financial department masters the economic lifeline of an enterprise and is one of the enterprise’s most critical departments. Finance is closely related to the operation and development of the enterprise and usually involving in complex settings. What is Financial Reporting? Free Download. Financial Statements.
Whether you are a software vendor, and IT consultant or a software customer, you have probably endured your share of software demos. Unfortunately, not every software demo is successful and, when things go wrong, it can be frustrating, and disappointing, for a customer and devastating for the vendor or consultant trying to sell a product.
The design of reports can be considered from two aspects: layout and system. You may have seen many articles emphasize how to improve the layout of the report. Today, let’s learn the report designing from the perspective of the report system. The Basics of Report Designing . The Basics of Report Designing .
Weve all seen the demos of ChatGPT, Google Gemini and Microsoft Copilot. They can also automate report generation and interpret data nuances that traditional methods might miss. with over 15 years of experience in enterprise data strategy, governance and digital transformation. Theyre impressive, no doubt.
Most projects at work involve lengthy and jumbled data, wherefore well-structured analytical reports are particularly important. This article shows you all the major topics that you care about in analytical reporting: What is Analytical Report? Analysis Report Examples How to Write Analytical Reports Effectively?
Take SAP reporting as an example. The tools that come built into the ERP make reporting possible, but they miss the mark when it comes to finance. Some of the most common complaints relate to the fact that the SAP financial reporting process is confusing and cumbersome, often requiring help from the IT team.
Create a report on Google Analytics. Select the application type Web application , enter the name demo-google-aws, and provide URIs for Authorized JavaScript origins [link]. Select demo-google-aws. For this demo, you can upload the Nation Market segment file to your Google sheet before proceeding to the next steps.
One of the law’s main requirements is that senior management and the board of directors must take full responsibility for the accuracy of the company’s corporate governance and financial reporting. Make sure the enterprise financial planning software you choose can be customized to your needs. Request Demo Now.
Apa Itu Crystal Report? Crystal Report adalah sebuah software pembuat laporan windows-based yang bermula sejak tahun 1991. Crystal Report dapat mengintegrasi sampai dengan 12 format data source dan membuat laporan yang dinamis. SAP mengakuisisi Crystal Report di tahun 2007. Alternatif Crystal Report.
Unlocking deeper payout intelligence and global insights To continue our innovationand to continue to exceed our partners and customers expectationswe knew we needed to go beyond basic reporting. We know success is dependent upon developing a truly data-driven organization.
Financial and operational reporting for NetSuite can be a challenge. As is the case with many ERP systems, NetSuite’s reporting capabilities tend to be somewhat restrictive. It can be difficult to pull information from multiple NetSuite modules into a single, cohesive report.
What is Crystal Reports?. Crystal Reports is a popular windows-based reporting tool that originated in 1991. It can integrate up to twelve formats of data sources, and create dynamic reports. . SAP acquired Crystal Reports in 2007. The latest version released is Crystal Reports 2016.
Tax planning is playing an increasingly important part in corporates’ enterprise resource management (ERM) strategies, driven by the many uncertainties created by political, economic, and pandemic-related trends. Book a demo, or drop us a line. The Role of Tax Teams.
S3FileIO" --conf "spark.hadoop.fs.s3a.aws.credentials.provider=org.apache.hadoop.fs.s3a.SimpleAWSCredentialProvider" --conf "spark.sql.catalog.spark_catalog.rest-metrics-reporting-enabled=false" See Accessing Amazon S3 Tables with Amazon EMR for upgrades to software.amazon.s3tables package versions. impl=org.apache.iceberg.aws.s3.S3FileIO"
More importantly, open APIs make it easy for IT staff to customize reporting systems. As the business intelligence software, Square Dashboard offers quick insights and advanced sales reports. As Square introduces, ‘From real-time reports to customer contacts, you have everything at your fingertips to make wise business decisions.’.
It’s necessary to say that these processes are recurrent and require continuous evolution of reports, online data visualization , dashboards, and new functionalities to adapt current processes and develop new ones. Understand the expected information delivery avenues: reports, dashboards, ad hoc reporting , etc.
The results showed that (among those surveyed) approximately 90% of enterprise analytics applications are being built on tabular data. What could be faster and easier than on-prem enterprise data sources? And no one could deny that these benefits would be substantial.
” That’s a quote from a recent Gartner report underscoring the critical importance of data for today’s companies. Adding further emphasis, the report goes on to predict that by 2022, 90 percent of corporate strategies will classify data as a critical asset and list analytics among the core competencies.
Creating financial reporting from any ERP is not simple, but in SAP’s case, there is an added level of frustration that users go through : what seems like thousands of extra clicks to get the data you need, and then again to put it into context for your reporting. . Key Issues with SAP Data and Native Reporting .
Almost 70 percent of CEOs say they expect their companies to change their business models in the next three years, and 62 percent report they have management initiatives or transformation programs underway to make their businesses more digital, according to Gartner. Click here to request a free demo of erwin DI.
Modern enterprise business intelligence (BI) tools and practices enable quick decision making. What is enterprise business intelligence? In any case, enterprise BI increases productivity and efficiency. That is to say, enterprise business intelligence tools are the implementation of BI across an organization. Definition.
There is a significant shift in tools, processes, and skills being used in the enterprise. As a result, low-code/no-code next-gen technologies are starting to reach the enterprise. As enterprises increasingly look to outsource or bring in third-party providers, they are starting to embrace low-code/no-code tools.
You need robust software solutions with complex machine learning and data analytics algorithms to systematize, simplify, and standardize them for more precise, compliant reports. Additionally, Trullion offers visual, intuitive, and straightforward dashboard functionalities to ease their daily tasks and reports. Image source: Trullion.
The Rockefeller Principles, touted by innovative business leaders as the bedrock values of high-growth enterprises, place a strong emphasis on cash, listing it as one of the four pillars of good management. The stock reports that come with most ERP systems can’t typically answer those kinds of questions. Lever 2: Accounts Receivable.
From a single solution, organizations can embed cost-effective AI, interactive data visualizations, dashboards, and reports, enhancing the value and engagement of any application RALEIGH, N.C. This ensures that any reporting is powered by clean, accurate, comprehensive data that generates more impactful and timely insights.
QuickSight makes it straightforward for business users to visualize data in interactive dashboards and reports. You can slice data by different dimensions like job name, see anomalies, and share reports securely across your organization. For now, let’s filter with the job name multistage-demo. Let’s drill down into details.
Over 4,000 attendees saw a lot of demos showing how to effortlessly build a modern data platform with petabytes of data in One Lake, and then ask CoPilot to generate beautiful Power BI reports from semantic models that magically appear from data in a Fabric Lakehouse.
In essence, Mr. Pörschmann laid out the “ enterprise data dilemma ,” which stems from three important but difficult questions for an enterprise to answer: What data do we have? erwin Data Intelligence by Quest supports enterprise data governance, digital transformation and any effort that relies on data for favorable outcomes.
Critically, it makes it easier to get a clear view of how information is created and flows into, across and outside an enterprise. Also, different organizational stakeholders (customers, employees and auditors) need to understand and trust reported data. Benjamin Franklin said, “Lost time is never found again.”
It’s been one year since we’ve started publishing the Alation State of Data Culture report, and uncertainty still remains the only sure thing. The Alation State of Data Culture Report provides a quarterly assessment of the progress enterprises have made in creating a data culture. Data Culture Separates Winners From Losers.
For Healthcare enterprises, these prove beneficial to all stakeholders, including patients, providers, payors, and policymakers via end-user touchpoints. 1: Operational Reporting & Performance. Report automation?can Beyond the Basics: 6 Best Practices for your Operational Reporting Workflow. Access Resource.
We organize all of the trending information in your field so you don't have to. Join 42,000+ users and stay up to date on the latest articles your peers are reading.
You know about us, now we want to get to know you!
Let's personalize your content
Let's get even more personalized
We recognize your account from another site in our network, please click 'Send Email' below to continue with verifying your account and setting a password.


Let's personalize your content