article thumbnail

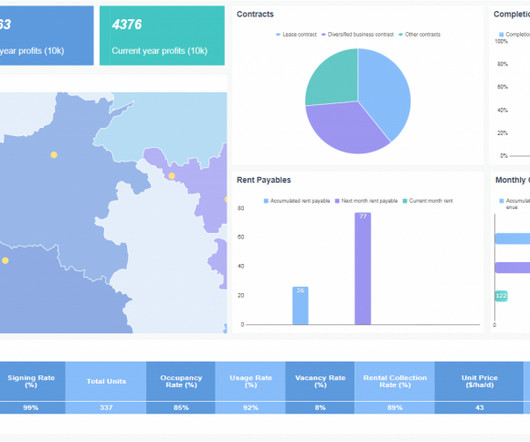
What is a KPI Report? Definition, Examples, and How-tos

FineReport

To effectively monitor and analyze these metrics, businesses utilize KPI reports. In this article, we will explore the concept of KPI reports, highlight their significance, provide examples and templates, discuss the essential components, and offer valuable insights on creating KPI reports efficiently.

KPI 52
article thumbnail

Unveiling the Path to Success as a Data Visualization Specialist

FineReport

In today’s data-driven world, the data visualization specialist plays a pivotal role in transforming complex information into visually appealing formats. As companies seek to leverage data visualization expertise, individuals with the ability to present data in innovative ways are highly sought after.

Insiders

Sign Up for our Newsletter

This site is protected by reCAPTCHA and the Google Privacy Policy and Terms of Service apply.

Trending Sources

article thumbnail

Master Data Visualization Techniques: A Comprehensive Guide

FineReport

Data visualization techniques are paramount in today’s data-driven world. Mastering data visualization techniques is not just a skill but a necessity for professionals across various industries. Definition and Importance Visualizing data involves representing information through graphical elements like charts and graphs.

article thumbnail

Dashboard Metrics: Your KPI Guidelines and Practices

FineReport

These KPI metrics are critical data to analyze and evaluate a company’s sales, human resources, and marketing, and operational activities. KPI Dashboard (From FineReport?. For example, track the efficacy of particular sales efforts using a measure or KPI (Key Performance Indicator). Dashboard metrics from FineReport.

KPI 52
article thumbnail

Designing Charts and Graphs: How to Choose the Right Data Visualization Types

datapine

Modern dashboard software makes it simpler than ever to merge and visualize data in a way that’s as inspiring as it is accessible. Knowing what story you want to tell (analyzing the data) tells you which data visualization type to use. Let’s assume you have the right data and the right data visualization software. Distribution.

article thumbnail

Why Dashboard Visualization Matters in the 21st century?

FineReport

Data dashboard visualization plays a key role in business, whether about analysis or decision. It empowers every user to understand complex data in a visual way. Now, let’s explore the dashboard visualization! What is Dashboard Visualization? dashboard visualization (by Finereport?. Just a link to their dashboards!

article thumbnail

Huabao sniffs out the ultimate efficiency formula

CIO Business Intelligence

Major finance and business information, along with sales and subcontracting documents, were processed manually and offline. Without visualized analytics, it was difficult to bridge the void between expectation and accurate analysis. Even as the Huabao Group expanded, its digitization effort lagged.