This site uses cookies to improve your experience. To help us insure we adhere to various privacy regulations, please select your country/region of residence. If you do not select a country, we will assume you are from the United States. Select your Cookie Settings or view our Privacy Policy and Terms of Use.
Cookie Settings
Cookies and similar technologies are used on this website for proper function of the website, for tracking performance analytics and for marketing purposes. We and some of our third-party providers may use cookie data for various purposes. Please review the cookie settings below and choose your preference.
Used for the proper function of the website
Used for monitoring website traffic and interactions
Cookie Settings
Cookies and similar technologies are used on this website for proper function of the website, for tracking performance analytics and for marketing purposes. We and some of our third-party providers may use cookie data for various purposes. Please review the cookie settings below and choose your preference.
Strictly Necessary: Used for the proper function of the website
Performance/Analytics: Used for monitoring website traffic and interactions
An important part of a successful business strategy is utilizing a modern data analysis tool and implementing a marketing report in its core procedures that will become the beating heart of acquiring customers, researching the market, providing detailed data insights into the most valuable information for any business: is our performance on track?
Download our game-changing summary and see your company grow! There is no doubt that today, self-service BI tools have well and truly taken root in many business areas with business analysts now in control of building their own reports and dashboards rather than waiting on IT to develop everything for them.”. Let’s get started!
We can start to create some lovely music, and it will come via the use of custom reports – one of my favourite features in any digital analytics tool. Notice I did not say standard reports, those barely cross the bar of data puking. I said custom reports. So, demand custom reports even on day one if you can.
I recommend that periodically you gather folks around you for lunch, pull up Adobe Analytics on the big screen in the conference room, let each person expose one hidden report or feature. In that context, Real-Time reports are an impressive feat of engineering by the team at Google. There is a difference between reporting and analysis.
FineReport is a well-known brand of reporting software, with many cooperative customers, high market share, and rich industry experience. Business personnel can quickly produce analysis reports. Business personnel can quickly produce analysis reports. Free Download. Summary of sales report(by FineReport).
Take financial reports as an example. If the metrics in those reports are off in any way, it gives decision makers a skewed perspective of enterprise performance. Depending on the error, executives and department heads (or anyone else who relies on the reports) may have a wildly inaccurate understanding of performance.
Power BI’s rich reports or dashboards can be embedded into reporting portals you already use. Its dashboards, reports, and visualizations go far beyond bar and pie charts, but you don’t need to be a designer to create them.
12: Almost all reporting is off custom reports. #11: 6: All automated reports are turned off on a random day/week/month each quarter to assess use/value. #5: Reporting Squirrels vs. Analysis Ninjas. No company hires anyone called a Reporting Squirrel. It is specific, it is, this will not surprise you, impactful. #12:
When you have reporting tools that make it easy to slice and dice data from inside and outside the accounting department, you can generate dozens of different financial ratios. The importance of financial ratios highlights the challenges of financial reporting. Download the dashboard for free.
Web Analytics – With access to web analytics, your team members can leverage the business intelligence portal to slice and dice, drill down, drill through and view and share comprehensive reports, so every team member has the detailed reporting they will need to solve problems and to improve results.
Integrating analytics with Tally ERP can add crucial value by allowing your professionals to go beyond simple reporting to analyze data, spot trends, identify opportunities and solve problems. Users can Download And Register for SmartenApps for Tally and use Tally data to analyze, explore and clarify.
Augmented Analytics Takes Tally ERP Beyond Data Entry and Reporting! Go beyond data entry and simple reporting to offer both high-level and detailed drill-down analytical capability that is suitable for use in decision-making and in adding value to the organization in an advisory role. Let’s talk numbers!
Today, Tally ERP provides an integrated data analytics solution with out-of-the-box reporting and tools that are easy enough for every team member, no matter their technical skills. Expand Insight and Reporting Capabilities. Original Post : Combine Tally ERP with Analytics and Improve ROI!
Yes, it does summarize data from many reports into one. You are just acting as a glorified report writer. For example, this post Google Analytics Custom Reports: Paid Search Campaigns Analysis , has three great CDPs for your Paid Search team. But think of what's on it for a moment. And now, pull back.
Web Access to Accounting Analytics Reporting is Crucial to Business Success ! In the past, the accounting function was often seen as a ‘bean counter’ function, producing simple, columnar reports and tracking expenses and revenue. ‘A
Leverage Integrated Analytics Reporting in Tally ERP ! There is no doubt that the amount of information contained in accounting and finance systems can be daunting but analysis of this data in an easy-to-use reporting environment can reap numerous rewards without reducing productivity or frustrating users.’.
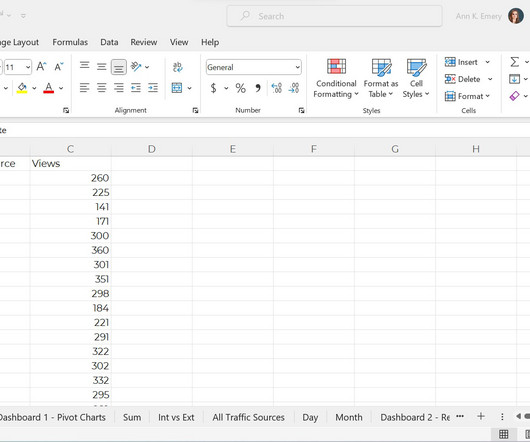
We’re pretending that we’ve downloaded YouTube stats directly from YouTube. It’s raw because this is exactly what it looks like when downloaded from YouTube. If I want viewers to be able to slice and dice by month, then I’d select Month – Name to feed into the slicer. That’s it!
However, NetSuite’s native reporting tools, while helpful for basic tasks, can create serious roadblocks to data trust within your organization. Delays in generating custom reports leave your leadership with outdated information, hindering informed decision-making. Forget data-chasing and siloed spreadsheets.
Short story #4: Multi-dimensional Slicing and Dicing! It is created using the All Traffic Sources report in Google Analytics, and clicking Source (rather than the default Source/Medium). Ignore the black line for a moment (it shows the actual reported cases of infection). Short story #5: Segmented Stacked Square Charts.
I can report on pageviews and bounce rates and sessions and all the other lovely metrics we normally obsess about. Other macro-outcomes you can use, depending on the type of your business, are live chats, phone callback requests, downloads completed, wish-lists created, new accounts opened, and more. It sucks to be there.
But many companies fail to achieve this goal because they struggle to provide the reporting and analytics users have come to expect. These tools prep that data for analysis and then provide reporting on it from a central viewpoint. These reports are critical to making decisions. that gathers data from many sources.
To celebrate our partnership’s 100th customer, we sat down with Michael Heinsdorf, director of product alliances and corporate development at Deltek to discuss the partnership between Deltek and insightsoftware (ISW), and how the collaboration has helped clients increase efficiency, boost ROI, and reduce time spent generating financial reports.
While financial reporting and compliance are still key responsibilities of the role, more and more businesses are now leaning on a CFO’s management expertise to help inform strategic decisions. Figure 1 CFO Evolution Survey Report, Armanino LLP, 2017 All rights reserved. Powerful Tools.
But a hidden roadblock can impede your progress: report generation. Traditional reporting methods often require technical skills to build queries and wrangle data, creating a bottleneck for finance teams who lack in-house expertise. Inefficiency and Bottlenecks: The reliance on IT for custom reports creates a bottleneck.
We should be clear from the outset that BI is fundamentally different from reporting. Virtually every business on the planet has some kind of reporting mechanism in place–even if it’s just a simple set of off-the-shelf printouts that come from basic accounting software. Business reporting is more operational in nature than BI.
Analytics is vital now because providing end-users with the ability to analyze, slice, and dice data within the context of their application is essential to staying competitive in today’s fast-paced digital world. Creating Analytics Functionality in Products: Lessons Learned Download Now How Is One Different From the Other?
Epicor’s built-in reporting capabilities are useful for standard reports but can be limiting for organizations that require more advanced analytics. Without deep technical knowledge of Epicor’s data structures, attempting to manually create custom reports can create serious roadblocks to data trust within your organization.
We organize all of the trending information in your field so you don't have to. Join 42,000+ users and stay up to date on the latest articles your peers are reading.
You know about us, now we want to get to know you!
Let's personalize your content
Let's get even more personalized
We recognize your account from another site in our network, please click 'Send Email' below to continue with verifying your account and setting a password.


Let's personalize your content